
Analysis of Supplementary Figures from Elizabeth Roundhill Study
This document presents an analysis of Elizabeth Roundhill's supplementary figures, specifically focusing on Figures 2B and 2C. It discusses significance levels (p < 0.01) observed across various cell lines, including MCF-7, SKES-1, A673, and SK-N-SH, showcasing the different responses and patterns noticed under experimental conditions involving DEPC-treated water and control comparisons. The study provides insight into cell viability and proliferation results across diverse platforms, fostering a deeper understanding of cellular responses in cancer research.

Analysis of Supplementary Figures from Elizabeth Roundhill Study
E N D
Presentation Transcript
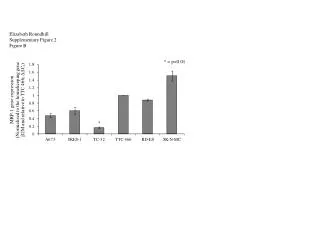
Elizabeth Roundhill Supplementary Figure 2 Figure B (a) * = p<0.01 *
Elizabeth Roundhill Supplementary Figure 2 Figure C 2652 bp 800 bp 350 bp ←306 bp ladder Me U Me U Me U Me U Me U Me U Me U Me U Me U Me U Me U HFF RD-ES MCF-7 SKES-1 A673 TC-32 SK-N-SH TTC 466 DEPC ddH2O SK-N-MC TC-32+M.SssI Controls