Download
1 / 28
300 likes | 541 Views
Food Quality Evaluation Techniques Beyond the Visible Spectrum. Murat Balaban Professor, and Chair of Food Process Engineering Chemical and Materials Engineering Department University of Auckland. Definition of Food Quality. Safety - Microbial, chemical Nutritional content

E N D
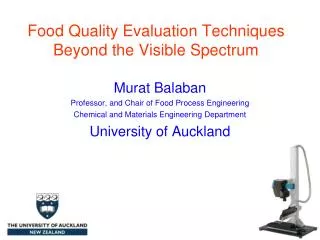
Food Quality Evaluation Techniques Beyond the Visible Spectrum Murat Balaban Professor, and Chair of Food Process Engineering Chemical and Materials Engineering Department University of Auckland
Definition of Food Quality • Safety • - Microbial, chemical • Nutritional content • - Micronutrients, macronutrients (composition) • Physical and Chemical Properties • - Texture, age, etc • Appearance and sensory attributes • - Freshness, ripeness, wholesomeness.
Context Measurement of the quality attributes, using machine vision / image analysis: - Non-destructive - Near real-time - Reliable - Distribution as opposed to average values.
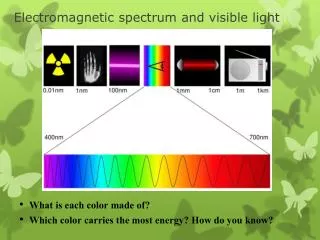
Spectrum “Traditional” Machine vision
Light at different wavelengths interacts with matter differently
Advantage of hyperspectral Machine vision Spectroscopy Fast Separates wavelengths Averages the view area (spatial) Spatially resolves at pixel level Averages wavelengths Hyperspectral Imaging Separates at pixel level Separates wavelengths.
Hyperspectral imaging Wavelengths between 200 and 2500 nm. The food sample is scanned with many wavelengths. Can measure moisture, lipids, astaxanthin,…
Methods 1- Reflectance Spectrometer or camera Light source Sample
Methods 2- Transmittance Spectrometer or camera • Two difficulties: • Thickness affects penetration • Light disperses Light source
Methods 3- Interactance
Measurement examples UV Detection of bones and parasites in fish (Barnes, 1986)
Parasites Manual detection 75% effective Imaging spectroscopy: Depth up to 0.8 cm detected Speed: 1 fillet/sec 40 cm/s
Composition Different chemical bonds absorb at different wavelengths It is possible to scan the food using many wavelengths, and correlate these with chemically measured composition. Both the UV and IR range can be used.
Composition of cow components US Patent 4,631,413
Cocoa powder Near infrared reflectance factor (R) spectra were recorded for 60 cocoa powder samples The spectra were transformed to log (R) versus l, and to the second derivative of log (1/R) versus wavelength for correlation with compositional data Linear stepwise regression techniques were used to determine the optimum l and other parameters for predicting chemical constituents The ratio of second derivatives of log (1/R) measured at two characteristic wavelengths.
Composition of cocoa powder Kaffka et al., 1982
Fish ElMasry and Wold, 2008
Hyperspectral water and fat analysis Atlantic halibut Catfish Cod Herring Mackerel Saithe
Oyster Composition Oysters were homogenized Composition was measured by wet chemistry, then scanned high throughput: 250–300 samples can be analyzed for moisture, fat, protein and glycogen each day. Brown 2011
Protein Moisture Glycogen Fat
Meat Ageing (Firtha, 2012)
Methods of Data Analysis • Chemometrics: • These methods include (not exclusively): • partial least squares (PLS) regression, • multiple linear regression (MLR), and • principal component analysis (PCA). Pork quality
Summary In addition to visible light analysis (size, color, shape, texture, etc) UV and IR regions can also be used for quality evaluation. These include composition, specific objects (e.g. parasites, or bones), tenderness. Advantages: Use of multiple wavelengths allow more insight into the materials Disadvantages: Multiple wavelengths require complex chemometric analysis.
Thank you JenOptik 60 mm macro Lens UV-VIS-IR Nikon D300S UV and IR filters removed