Download
1 / 9
100 likes | 196 Views
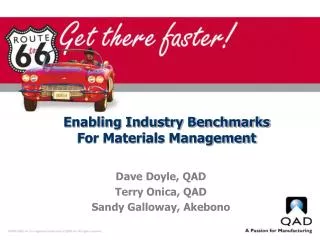
Industry Benchmarks. How do you measure up?. Driver Qualification Standards.

E N D
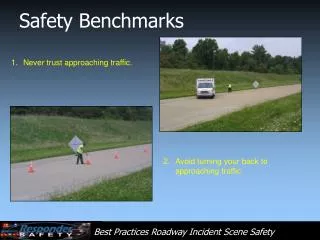
Industry Benchmarks How do you measure up?
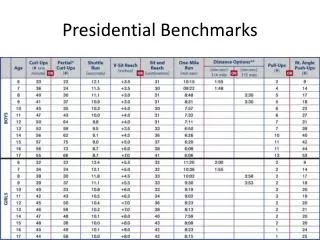
Driver Qualification Standards • For years insurance companies have been tightening up their driver MVR standards. Many carriers are asking why they cannot hire drivers with moving violations, etc. The chart on the following slide will show the correlation between moving violations and the likelihood that a driver will have an accident. How do your drivers stack up?
Relative Subsequent-Accident Risk(Times-As-Many Index) Number of Moving Violations *California Department of Motor Vehicles
Frequency of Crashes • Data published by the Federal Motor Carrier Safety Administration (FMCSA) in January 2003 shows the following frequency for heavy truck crashes per 100 million miles. • Fatal Crashes/100 Million Miles: • 1975: 2.9 • 2001: 1.4 • Injury Crashes/100 Million Miles: • 1988: 110.2 • 2001: 72.0 • Property Damage Crashes/100 Million Miles: • 1988: 227.6 • 2001: 154.0
Driver Turnover • The driver turnover rate in 2004 is currently running at 116% • Truckload driver turnover reached an all time high in the 3rd quarter of 2003 at 119% • Same period in 2002 it was 106% • *NOTE – statistics show that drivers who are in their first year with a company regardless of how many years of experience they have are more likely to have an accident.
Fuel Conservation • Traveling 65 mph versus 55 mph can consume 18% more fuel • Most tractors consume more than 1 gallon of fuel per hour while idling • Approximately $5,000 in fuel annually per truck • 87% of all flat tires have a history of under inflation (Society of Automotive Engineers) • A 10% psi drop in tire pressure will increase fuel consumption by .5% to 1%
Best Practices • A study conducted by Liberty Mutual found the following: • Companies with 70 percent or more clear driving records had a 30% lower median crash frequency • Companies that conducted extensive pre-hire road tests taking longer than two hours had a crash frequency that was 30% lower than the companies with shorter road tests • Companies that set speed governors below 70 mph had a 35% lower crash frequency
Establish Your Own Benchmarks • Most of the newer model tractors in use today have data recorders that can be used to download information that can be used to measure your fleets performance • Average speed, number of hard brakes, hard acceleration, turn signal use, time in cruise control, idle time, etc. • This data can be downloaded for several months on the fleet and averaged to set a base line to work from. Then this base can be used to set goals and monitor driver performance.
Establish Your Own BenchmarksContinued • The other data tracking and analysis tools on this CD will help you in establishing benchmarks to measure your company’s performance and set goals for improvement. • You can also use information contained in your Carrier Profile, Safer Snapshot, and Safestat reports