Polymorphism: the raw material of evolution
350 likes | 597 Views
Polymorphism: the raw material of evolution.

Polymorphism: the raw material of evolution
E N D
Presentation Transcript
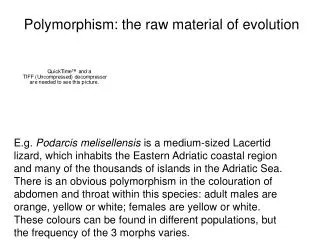
Polymorphism: the raw material of evolution E.g. Podarcis melisellensis is a medium-sized Lacertid lizard, which inhabits the Eastern Adriatic coastal region and many of the thousands of islands in the Adriatic Sea. There is an obvious polymorphism in the colouration of abdomen and throat within this species: adult males are orange, yellow or white; females are yellow or white. These colours can be found in different populations, but the frequency of the 3 morphs varies.
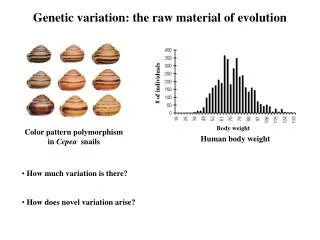
Our example: Cepaea nemoralis
Homozygotes Heterozygotes Other homozygotes Marker lane BACKGROUND: Alterations of the HER2 proto-oncogene have been implicated in the carcinogenesis and prognosis of breast cancer. A polymorphism at codon 655 (GTC/valine to ATC /isoleucine [Val655Ile]) in the transmembrane domain-coding region of this gene has been identified and may be associated with the risk of breast cancer. Journal of the National Cancer Institute, Vol. 92, No. 5, 412-417, March 1, 2000 Xie et al.
Understanding the Mendelian view of polymorphism, and the nature of fitness differences helps overcome some difficulties with understanding the genetics of evolution that troubled Darwin himself. Michael Bulmer (2004), has set out the main issues: Fleeming Jenkin argued that natural selection would be ineffective in selecting a rare “sport” (mutant) because it would be swamped by backcrossing to the normal population. Bulmer (2004) BJHS 37(3): 281-297
Jenkin’s argument: as an illustration [steeped in the ingrained racism of the time] he supposed that a white man was wrecked on a desert island inhabited by Africans: • Our shipwrecked hero would probably become king; he would kill a great many blacks in the struggle for existence; he would have a great many wives and children, while many of his subjects would live and die as bachelors. In the first generation there will be some dozens of intelligent young mulattoes, much superior in average intelligence to the negroes. We might expect the throne for some generations to be occupied by a more or less yellow king; but can any one believe that the whole island will gradually acquire a white, or even a yellow population?
Paul Janet’s version: Paul Janet, the late nineteenth-century French philosophical writer and opponent of Darwinism, supposed that dark skin colour was an advantage in hot countries, and he imagined that in one of these countries there was a white population among whom a single black person appeared. He would marry a white person, and their child would be mulatto, their grandchild quadroon, and so on, until eventually any hint of dark colour would disappear along with any advantage.
A traditional interpretation is that this was a valid objection to Darwinism given the blending theory of heredity current in the nineteenth century, but that the problem vanished with the acceptance of Mendelism. Why? As we saw in our revision of the first year material, the particulate inheritance means that back-crosses will comprise of heterozygotes and the original homozygotes (and occassionally some of the “sport” homozygotes). Actually as AS Davis, a maths teacher from Leeds Grammar School, pointed out in 1871 that the logic of the back-crossing argument is actually wrong, even if blending inheritance was what happened, since the reduced advantage for each individual in successive generations would be counter-balanced by the greater number of individuals.
The neo-Darwinian synthesis understands natural selection as a process acting on the genetic variation within a population. What explains the existence of this polymorphism?
Explaining polymorphism (the raw material for evolution) and differentiation Four fundamental processes Origin: Mutation Spread or loss within a population: Genetic drift and Selection Movement from one population to another: Gene flow
At the most fundamental level, mutation. But why are different alleles present in the population at any one time? In other words why are populations polymorphic? Drift tends to fix alleles, but in large populations, or a network of small populations connected by gene flow, this may take so long that there is an appreciable period when more than one allele survives.
In the introductory lectures we considered one form of selection that could maintain polymorphism heterozygote advantage. It is important to remember that there are other forms of balancing selection. The example of human left-handedness serves to remind us that it is not enough to find that some selection processes act to increase or decrease and others to decrease it. There must be frequency dependence.
The devil is traditionally left handed (sinister) Justice is right-handed!
Leaving aside superstition, perhaps based on the time-honoured principle of picking on minorities, left-handedness seems to be associated with several fitness costs, such as a lower height or a reduced longevity (e.g. Aggleton, Kentridge and Neave, 1993; Coren and Halpern,1991; Gangestad and Yeo, 1997; McManus and Bryden, 1991 & many more on the web-site). The costs reported in the literature are not likely to be frequency-dependent. A frequency-dependent advantage is therefore required to explain the maintenance of the polymorphism (see Raymond references on web site).
How do we know its frequency relatively unchanged? Why does it need a frequency dependent advantage to explain its persistence at a similar frequency? What might this advantage be? How could we evaluate this hypothesis
Examples of genetic markers used in population surveys. Visible phenotype Protein electrophoresis RFLP analysis Fingerprinting (minisatellite, microsatellite) DNA sequencing
Examples of genetic markers used in population surveys. Visible phenotype Protein electrophoresis RFLP analysis Fingerprinting (minisatellite, microsatellite) DNA sequencing
http://www.cf.adfg.state.ak.us/geninfo/research/genetics/techfac/images/allozyme/gelload4.jpghttp://www.cf.adfg.state.ak.us/geninfo/research/genetics/techfac/images/allozyme/gelload4.jpg
Homozygotes Heterozygotes
Not all alleles are distinguished (30%), even so there is a huge amount of polymorphism: so much so that it lead to a radical change in evolutionary theory.
E.g. Single nucleotide polymorphisms or SNPs. The bacterial artificial chromosomes (BAC) clones used to assemble the human genome, can be compared when they come from different chromosomes from the same individual (maternal & paternal); the number of differences between two chromosomes averaged 1/1331 sites of the DNA. Differences between human individuals were estimated to be 1 per 1000 bp. This has subsequently been verified by DNA sequencing
Dickerson (1971) corrected amino acid changes per 100 residues (m) Millions of years since divergence The estimates of differences between species have been verified by comparisons of DNA sequence and protein sequence. They indicate roughly 1 aa substitution every 10 years, And many more DNA substitutions.
Examples of genetic markers used in population surveys. Visible phenotype Protein electrophoresis RFLP analysis Fingerprinting (minisatellite, microsatellite) DNA sequencing
Short tandem repeats (STRs) 2-6 bp repeat units. High mutation rate (up to 10-2+ ?) Amplified by PCR Automated screening using fluorescent primers and laser detection Used in forensic science
Examples of genetic markers used in population surveys. Visible phenotype Protein electrophoresis RFLP analysis Fingerprinting (minisatellite, microsatellite) DNA sequencing
A B C Large differences Small difference • Types of comparison • Frequency differences between populations • Trees: Populations which differ little in their allele frequencies are assumed to have a recent common ancestor: • Problems: estimates are disrupted by gene flow, drift, selection
A B C Large differences Small difference • Number of differences in a DNA sequence • (nb. In this case it is individual alleles that are being compared not whole populations) • Trees: the smaller the number of differences the more recent the common ancestor is assumed to be. • But: estimates are disrupted by recombination (use • mitochondria, chloroplasts, Y-chromosome) • by recurrent mutation, and by selection. In this case A, B & C could be sequences from different species or within a single population!
Hardy-Weinberg principle The allele frequencies are related to genotype frequencies (given certain assumptions) AA: p2 AB: 2pq BB: q2 Sperm p p2 pq Eggs pq q2 q q p
Non overlapping generations in a diploid sexual organism Random mating in a large population Negligible mutation, migration & selection Note difference from Punnet square. How many generations to equilibrium?
Detecting deviations from HW expectations eg Results from final year project on Culex molestus
Allozyme genotype AA AB BB Observed Counts 30 10 10 Expected counts 24.5 21 4.5 O-E 5.5 -11 5.5 (O-E)2/E 1.23 5.76 6.72 2=13.71 one d.o.f. nb do not do on table of % ! Calculation of expected for AA P=(30x2 +10) / 100 = 0.7 P2 x 50 = 24.5
Was something wrong with scoring? Is this the Wahlund effect? Undectected population sub-division Population 1 Population 2 High A frequency High B frequency Predominantly AA Predominantly BB
HW calculations can also be used to assess allele frequencies from genotype frequencies eg. Colour morphs eg. Blood groups Where homozygotes cannot be distinguished from heterozygotes. Expected number of the dominant phenotype is P2 + 2pq
HW calculations can also be used to assess the effects of Population bottlenecks & founder events: Eg if a population is reduced to 4 individuals then the probability of them having all the same allele is Prob(all homozygous for allele 1) +Prob(all homozygous for allele 2) +Prob(all homozygous for allele 3) etc.
Ie P18+P28+P38+... eg. 0.43 for bi-allelic locus, p1=0.9,p2=0.1; 0.008 for bi-allelic locus, p1=0.5,p2=0.5; Lesson: bottlenecks have to be sustained to result in substantial loss of genetic variation.