Download
1 / 50
510 likes | 929 Views
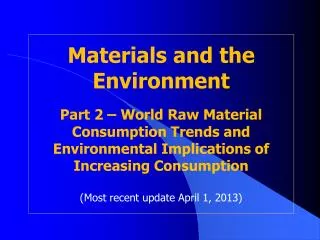
Materials and the Environmen t Part 2 – World Raw Material Consumption Trends and Environmental Implications of Increasing Consumption (Most recent update April 1, 2013). World Raw Material Consumption Trends. Molybdenum mining in Colorado. World Raw Material Consumption Trends.

E N D
Materials and the EnvironmentPart 2 – World Raw Material Consumption Trends and Environmental Implications of Increasing Consumption(Most recent update April 1, 2013)
World Raw Material Consumption Trends Molybdenum mining in Colorado
World Raw Material Consumption Trends • World and U.S. populations are growing. • World economic growth is much more rapid than the rate of population growth – as a result, per capita consumption of goods of all kinds is rising globally.
World Demand for Selected Raw Materials, 1961 – 2012Materials Used in Greatest Quanity(Million Metric Tons) Source: U.S. Geological Survey, Commodity Summary Statistics (2013). Data for wood from UN, FAOStat Forestry (2013).
World Demand for Selected Raw Materials, 1961 – 2012Important Metals(Million Metric Tons) Source: U.S. Geological Survey, Commodity Summary Statistics (2013).
World Growth in Consumption of Principal Raw Materials, 1961-2012 (Population growth during this period: 2.28x) SteelCementAluminumPlasticsWood 4.26x 11.10x 9.45x 48.33x 1.60x Source: Data for wood from FAO (2013); for cement, steel, and aluminum from the U.S. Geological Survey (2013); and for plastics from the Association of Plastics Manufacturers in Europe (2013).
U.S. Demand for Selected Raw Materials, 1961 – 2012Materials Used in Greatest Quantity(Million Metric Tons) Great recession Source: U.S. Geological Survey, Commodity Summary Statistics (2013). Data for 2010-2011 wood consumption from UN, FAOStat Forestry (2013); 2012 est.
If a full array of raw materials, including industrial minerals (limestone, clay, sand, gravel), are added to a graphic of materials consumption growth, the picture is even more dramatic.
U.S. Raw Nonfuel Minerals Put into Use Annually from 1900 through 2010 (materials embedded in imported goods not included) Source: U.S. Geological Survey (2012).
U.S. Raw Raw Materials Put into Use Annually from 1900 through 2010 (materials embedded in imported goods not included) Source: U.S. Geological Survey (2012).
In the next slide, raw material consumption growth is shown for two time periods for the United States: 1961-2005 and 1961-2012. Note the dramatically different numbers – pre-great recession and with the recent recession included within the time frame. Consumption patterns are likely to soon return to the 1961-2005 pattern.
U.S. Growth in Basic Raw Materials Consumption, 1961-2005 and 1961-2012 SteelCementAluminumPlasticsWood Population growth 1961-2005 – 1.61x ‘61-’05 1.68x 2.26x 3.48x 49.90x 2.37x Population growth 1961-2012 – 1.71x ‘61-’12 1.51x 1.39x 2.63x 42.40x 1.57x Source: Data for wood from USFS and estimates (2013); for cement, steel, and aluminum from the U.S. Geological Survey (2013); and for plastics from the National Commission on Materials Policy (1975) and the American Plastics Council (2013).
Principal raw materials globally and in the United States are cement, wood, and steel.
Annual World Consumption of Various Raw Materials, 2011 Billion Metric tonsBillion m3 Cement 3.600 1.1 Roundwood 1.739 3.5 Industrial roundwood* 0.794 1.6 Steel 1.520 0.19 Plastics 0.280 0.31 Aluminum 0.044 0.01 * The difference between roundwood and industrial roundwood is wood used for fuel. Roundwood includes both fuelwood and wood used in construction, and for making paper, furniture, and other wood products. Source: Data for wood from FAO (2013); for cement, aluminum, and steel from the U.S. Geological Survey (2013); and for plastics from the Association of Plastics Manufacturers in Europe (2013).
Annual U.S. Consumption of Various Raw Materials, 2011 Million Metric tonsMillion m3 Roundwood* 145 341 Forest products (wood only) 128 300 Cement 72 23 Steel 90 12 Plastics 47.5 53 Aluminum 3.6 1.3 * Roundwood is the volume of all wood harvested. More wood is consumed every year in the United States than all metals and all plastics combined. Source: Data for wood from UNECE (2013); for cement, steel, and aluminum from the U.S. Geological Survey (2013); and for plastics from the American Plastics Council (2012).
In view of this high and continuing rate of consumption, does this mean that the world is likely to soon run out of essential raw materials? The good news is that the world is unlikely to physically run out of most types of raw materials anytime soon.
However, there are a number of factors that may combine at some point to limit availability of critical resources. These include rising competition among nations and regions for resources, social issues, and environmental concerns.
Mineral resources have become more and more widely available despite (and partly because of) growing rates of consumption.
Ore quality is declining as consumption of metals rises. Highest Grades of Ore (generally exploited first) Lower Grades of Ore Lowest Grades of Ore
High quality ore contains a high percentage of metallic element in a given amount of ore.Low quality ore contains a low percentage of metallic element in a given amount of ore. Note: products that originate from low grade ore are not inferior in quality to products that originate from high grade ore.
There is a strong tendency for mineral resources to increase in quantity as the quality that can be economically exploited goes down.
There is a strong tendency for mineral resources to increase in quantity as the quality that can be economically exploited goes down. Highest Grades of Ore (generally exploited first) Decreasing ore quality Increasing ore availability Lower Grades of Ore Lowest Grades of Ore
Reserves of metals are typically expressed in years . . . or specifically asWorld Reserves Indices
To calculate the World Reserves Index, known reserves of a mineral that can be • extracted economically • at today’s prices • using today’s technology • are divided by current annual consumption of that mineral.
World Reserves of Selected Metals (expressed in years of supply) Source: Richards, J. 2009. Mining, Society, and a Sustainable World.
These numbers are sometimes interpreted as indicating that the world is about to run out of minerals.
However, World Reserve Index values tend to remain constant or even rise over time.
Nothing said here should be interpreted that all metals are infinitely available.
Also, while long-term availability of most metals is not an issue, the environmental impacts of procuring and processing ore, and especially increasingly lower grades of ore, present significant challenges.
Environmental concerns related to mining and metals production center on long-term impacts to nearby populations, landscapes, water supplies, and air quality and large impacts of conversion of ore to base metals and useful products.
Wood is a renewable resource. It is infinitely renewable as long as the forests from which it is obtained are managed sustainably.
There are about 4 billion hectares (10 billion acres) of forests in the world.
While forest area is declining in some parts of the world, it is stable or increasing in others. Decreasing Stable or increasing Similar trends can be seen in forest carbon stocks. Source: United Nations, FAO, Global Forest Resources Assessment, 2010.
Planted forests now make up about 7% of the total forest area globally – 264 million hectares (652 million acres). These supply about one-quarter of the annual harvest of wood used for forest products.
Deforestation is ongoing, but at a declining rate worldwide. Losses are wholly within tropical regions and largely attributable to conversion to agriculture – although other factors, including indiscriminate logging, play a role. Estimated Deforestation by Type of Forest and Time Period Source: United Nations, FAO, State of the World’s Forests – 2012.
In the United States, the World’s Largest Producer and Consumer of Wood Products: • Forest cover is within 1% of what it was in the early 1900s (33% of the land area). • Net growth greatly exceeds removals. • Forest inventory is increasing. • Forest carbon stocks are increasing. • Ongoing technology improvements have greatly increased the efficiency of wood use – now 99%+ of each log harvested.
Trends in U.S. Forestland Area 1630-2009 Million Acres Source: USDA – Forest Service, 2009.
U.S. Timber Growth and Removals, 1920 - 2006Billions of cubic feet/ year Figures above only include growth on forest land where periodic harvesting is allowed. Growth in reserves, parks, and wilderness areas is not included. Source: USDA - Forest Service
Standing Timber Inventory – U.S. 1952-2007 Billion Cubic Feet Inventory only includes forest land where periodic harvesting is allowed. Timber volumes in reserves, parks, and wilderness areas are not included. Source: USDA-Forest Service, 2007.
Forest Soil Carbon Inventory, U.S. 1990-2010 Billion Tons Carbon Source: USEPA (2012). Inventory of US Greenhouse Gas Emissions and Sinks, 1990-2011, p. 7-15.
A History of Wood Utilization Efficiency in the U.S. 100 90 80 70 60 50 40 30 20 10 0 Energy Production Percent of Log Volume Entering Sawmill Other Products Lumber 1930 1970 1985 2005 Source: Bowyer (2012). Data for United States, 2005.
Uses of Material Processed at U.S. Milling Sites - 2005 • 52% processed into lumber. • 36% converted to paper, particleboard, fiberboard, insulation board. • 11-12% used to generate energy. • ≤1% waste. Source: Bowyer (2012). Data for United States, 2005.
Consider the following illustration of the renewable nature of forests – and of the wood that they produce.
U.S. Population, Wood Harvest, and Net Forest Growing Stock Volume, 1952 and 2007 Growing stock volume increased by over 50%! Between 1952 and 2007, timber harvests increased by 3.8 billion cubic feet annually. So what happened to the volume of growing in U.S. forests? Billion ft3 Millions Million m3 Annual wood harvest expressed in m3 and growing stock in ft3 to fit to axes. Source: U.S. Census Bureau, 2005; U.S. Forest Service, 2004.
Environmental concerns linked to forest harvesting center around fears of deforestation and effects on forest values other than wood.
Summary • Consumption of both renewable and non-renewable raw materials is increasing. • Ongoing improvements in technology and informed management has allowed resource availability to keep pace with increasing consumption. • The world will not “run out” of raw materials anytime soon, though there are concerns about future availability of some key minerals.
Summary • With sustainable management (such as practiced in the United States), forests – and the wood that they produce, will never run out. • Environmental concerns related to rising resource use are increasing.