Engaging Data Collection and Analysis Project for Students: Surveys, Pictographs, and Bar Graphs
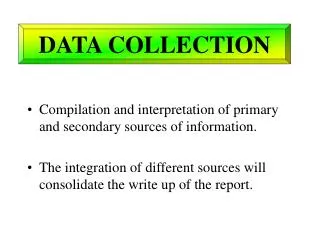
In this educational project, students will conduct a survey to gather data on their favorite writing instruments. They'll formulate survey questions, collect responses from peers using tally charts, and organize the information into pictographs and bar graphs. This will enable them to analyze their findings and draw conclusions about class preferences. The project aligns with math standards for data analysis and encourages effective communication through presenting findings. It fosters analytical skills while engaging students in hands-on learning.

Engaging Data Collection and Analysis Project for Students: Surveys, Pictographs, and Bar Graphs
E N D
Presentation Transcript
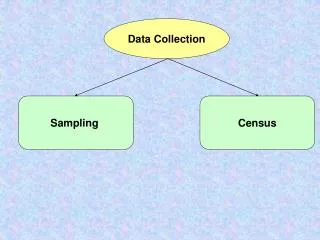
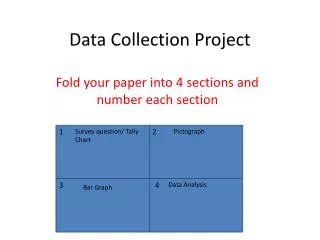
Data Collection Project 1 Survey question/ Tally Chart 2 Pictograph Fold your paper into 4 sections and number each section 3 4 Data Analysis Bar Graph
Section 1 Survey Question • Think of a question to ask the class. • What is your favorite…. • Give 5 choices • Example: what is your favorite thing to write with? • Regular pencil, mechanical pencil, pen, marker, crayon.
Section 1 Collect data on a tally chart (ask 15 students your survey question)
Section 2 Organize data in a pictograph Regular Pencil Mechanical Pencil Pen Marker Crayon =2 students
Section 3 Organize data on a bar graph Number of students
Section 4 Analyze your data • What do students like the most? The students like to write with a mechanical pencil the most. • What do students like the least? The students don’t like to write with the crayon. • If one more student voted, predict what they would vote for based on your data. Explain your answer. ______________________________________________ ______________________________________________ ______________________________________________ ______________________________________________
Standards covered Math Statistics, Data Analysis, and Probability 1.0 Students organize, represent, and interpret numerical and categorical data and clearly communicate their findings: 1.1 Formulate survey questions; systematically collect and represent data on a number line; and coordinate graphs, tables, and charts.1.2 Identify the mode(s) for sets of categorical data and the mode(s), median, and any apparent outliers for numerical data sets. ELA Listening and Speaking Strategies Organization and Delivery of Oral Communication1.5 Present effective introductions and conclusions that guide and inform the listener's understanding of important ideas and evidence.1.6 Use traditional structures for conveying information (e.g., cause and effect, similarity and difference, posing and answering a question).1.7 Emphasize points in ways that help the listener or viewer to follow important ideas and concepts. 1.8 Use details, examples, anecdotes, or experiences to explain or clarify information.1.9 Use volume, pitch, phrasing, pace, modulation, and gestures appropriately to enhance meaning. Speaking Applications 2.2 Make informational presentations: a. Frame a key question. b. Include facts and details that help listeners to focus.
Section 1 Survey Question What is your favorite_________________________________ _____________________________________ Collect data on a tally chart (ask 15 students your survey question) Predict what item will be chosen the most.
Section 2 Organize data in a pictograph __________ __________ __________ __________ __________ =2 students
Section 3 Organize data on a bar graph Number of students _______________ _______________ _______________ _______________ _______________ ________________________
Section 4 Analyze your data • What do students like the most? ___________ • What do students like the least? ___________ • If one more student voted, predict what they would vote for based on your data. Explain your answer. __________________________________________ __________________________________________ __________________________________________ __________________________________________