Download
1 / 21
210 likes | 370 Views
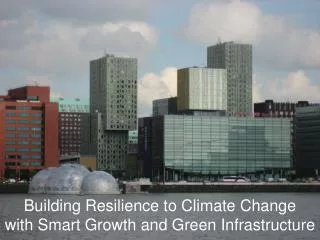
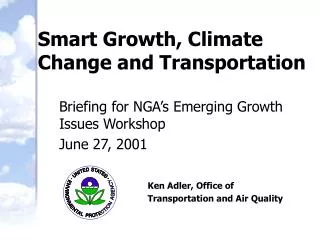
Smart Growth, Climate Change and Transportation. Briefing for NGA’s Emerging Growth Issues Workshop June 27, 2001 Ken Adler, Office of Transportation and Air Quality . Source: US DOE, EIA, Emissions of Greenhouse Gases, 1998; US EPA, National Air Pollution Trends, 1900 – 1998, 2000.

E N D
Smart Growth, Climate Change and Transportation Briefing for NGA’s Emerging Growth Issues Workshop June 27, 2001 Ken Adler, Office of Transportation and Air Quality
Source: US DOE, EIA, Emissions of Greenhouse Gases, 1998; US EPA, National Air Pollution Trends, 1900 – 1998, 2000.
The Transportation Slice of the Greenhouse Pie Other Aircraft Freight Trucks Transportation Industry Light Duty Buildings
Cumulative Housing Acres by Lot Size/Year (AHS, 1997) 160,000,000 140,000,000 10 to 22 120,000,000 5 to 10 100,000,000 1 to 5 1/2 to 1 80,000,000 1/4 to 1/2 60,000,000 1/8 to 1/4 0 to 1/8 40,000,000 20,000,000 0 1919. 1929 1939 1949 1959 1969 1979 1989 1999 Single Family Lot Size Has Increased Dramatically 10/23/00 5 *Includes 1995-99 projection, 14 million acres of homes active in farming.
Most New Homes Built in Smaller Communities% New Single Family Homes v. Community Size(AHS, 1997)
Percent New Homes Close to Stores (AHS, 1997) 60% 50% 40% 30% 20% 10% 0% 0 to 1/8 1/8 to 1/4 1/4 to 1/2 1/2 to 1 1 to 5 5 to 10 10 to 22+ Lot Size Lot Size v. Distance to Stores for New Single Family Homes
Lot Size v. Distance to Transport for New Single Family Homes
Moderate Scenario R&D increase Tax credits for PNGV Alternative fuels Telecommuting Advanced Scenario Voluntary CAFE Carbon emissions cap Technology and Trading Are Closing the Gap on Transportation GHG Emissions DOE “Clean Energy Futures” Study Transportation GHG Emissions Gap is at least 113 mmtce
Lowest Elevation and Storm Surge Heights for Selected NY/NJ Transportation Facilities Source: USACE, FEMA, NWS, “Metro NY Hurricane Transportation Study, Interim Technical Data Report.” November 1995.
50 states, 70 major metro areas: Induced VMT = 10%-30% of historical VMT 10% increase regional highway capacity = 2-5% VMT increase in 1-2 years 10% increase in highway capacity = 5-10% increase in VMT over 10-20 years Changes in development location, pattern Residential location, proximity to service areas Employee work location Employer business location Induced Travel from Infrastructure (EPA, 1999)
Induced Travel: Long-Term Elasticities of VMT
Change in VMT and NOx with Different Transportation Model Components: Sacramento 2000 to 2015
Goal: Sign up 1000+ employer partners to a new standard of excellence Timeframe: end of calendar year 2002 How: Agreement between EPA and employers Impact: Save over 2.2 MMT CO2 while reducing NOx, CO, and VOCs as well. Commuter Choice Partnership Program
The Approach: Inventory and evaluate freight management practices, e-commerce, technology and infrastructure opportunities; Review opportunities with stakeholders, identify common goals Draft MOU/Partnership Agreement/Common Understanding Launch and publicize voluntary program Freight Management ProgramThe work:Identify and implement voluntary truck technology and freight manage-ment practices that substantially reduceGHG and criteria air pollutants.
Catalyze and support innovations that result in transportation sector emission reductions First year: 10 to 15 projects selected through competitive RFP $50 - $300K per grant $1.25 Million program fund State, local, multi-state, and tribal governmental agencies eligible to receive funds Supporting State and Local PartnersClean Air Transportation Communities
Priority areas: Smart Growth, Commuter Choice and Green Fleet/Clean Vehicle Initiatives Received over 170 letters of intent Applications were due: April 24, 2001 Awards announced June, 2001 NALGEP: Coordinate/evaluate (under cooperative agreement) Supporting State and Local PartnersClean Air Transportation Communities
Goal Identify and implement voluntary and incentive based programs that substantially reduce GHG emissions and criteria air pollutants Emerging Strategies Transit for a Better Environment Green Vehicle Labeling/Green Vehicle Marketing Alliance Ground Freight and E-Commerce Partnerships Green/Clean Fleets Variable Priced Auto Insurance Green Tires Green Mortgages 2001-2002 Partnerships