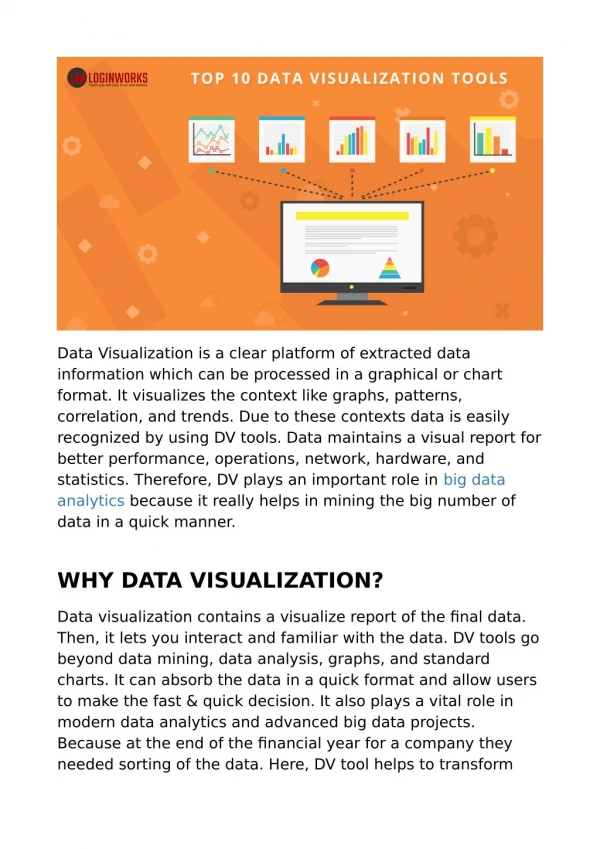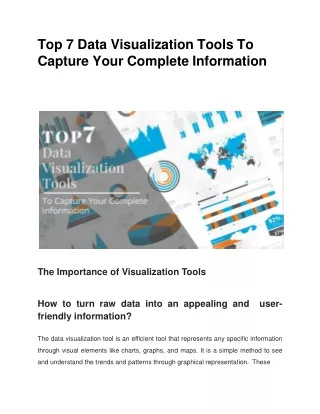
Top 7 Data Visualization Tools For Big Data
Nowadays, businesses hailing from all domains have to deal with massive amounts of data, and this is not limited to the MNCs and corporate giants alone. Thousands of SMBs also have to cope with ever-growing amounts of data. This data is obtained from multiple offline and online sources such as online polls, offline surveys, social media sites, cloud services and so on.

Top 7 Data Visualization Tools For Big Data
E N D
Presentation Transcript
TOP 7 DATA VISUALIZATION TOOLS FOR BIG DATA IMENSO SOFTWARE FollowUsonSocialMedia @imensosoftware www.imensosoftware.com
Nowadays, businesses hailing from all domains have to deal with massive amounts of data, and this is not limited to the MNCs and corporate giants alone. Thousands of SMBs also have to cope with ever-growing amounts of data. This data is obtained from multiple offline and online sources such as online polls, offline surveys, social media sites, cloud services and so on. Dealing with such enormous data with typical data processing applications is simply not possible. That is why businesses opt for specialized data visualization and business intelligence solutions nowadays. The basics of data visualization tools In business settings, using dedicated data visualization tools can be quite helpful. These applications help the users visualize all the gathered data in a logical, coherent and visual way. The tools come with plenty of inbuilt charts, dashboards, simulation, slide features embedded. These tools are also useful in generating reports based on various parameters and filters. The businesses that deploy such business intelligence services are able to analyze market trends and take important moves after obtaining a visual analysis of data. The top data vocalizations tools businesses are using worldwide Visme It is a feature-packed data visualization tool that can be useful for businesses belonging to many sectors. It ships with an impressive set of tools, a data widget library, chart templates and a graph maker. So, you can create different types of data visualizations. These visualizations are good for using in projects and presentations. Visme’s graph maker is quite powerful, and you can generate histograms, pie charts, bar graphs and line graphs. With this tool, it is possible to import data from Google Sheets. You can also generate useful social media reports as well as sales reports with its readymade templates. With the tool, you can create beautiful visuals even if you do not have the skill in designing. It does come with a free plan. The demanding users can pick from its standard and complete plans. Infogram Now a part of Prezi, it is a web-based data visualization creator tool. Infogram offers extensive options, and it is not mandatory to have a Prezi account. It is known for a simple and intuitive UI. The learning curve is low, making this tool a favourite with different types of users. You get plenty of maps and charts in it. The dashboard template library is of immense use. The tool is ideal for business owners and big companies, but it is also good for students and journalists. You get a free plan with limited features. Those with deep pockets can go for the Enterprise and personal plans. Tableau Tableau is among the most sought after data visualization tools. If you are looking for a worthy alternative to Power BI and do not want to hire a Microsoft power bi developer, this is worth a shot. The company offers data analytics and visualizations both for general users and corporate users. Tableau Public is free, and it lets you import data from spreadsheets, and manual entry is also supported. Tableau Desktop features laden and tailor-made for enterprise users. With TD, you can generate literally any kind of visualization, including interactive ones. Whatagraph This is a versatile data visualization tool ideal for SEO, social media and email campaigns. It integrates well with popular online tools and services such as Google Analytics and Twitter. You can also customize the Whatagraph data visualizations. You can easily integrate the tool with several services and then develop analytics dashboards. This tool is just right for serious digital marketers who want to offer impressive visual dashboards to clients. It is also ideal for social media managers who use multiple social platforms for their campaigns. There are many plans to pick from. Sisense This is a feature-laden business intelligence tool that is also useful for generating data visualizations. While it is meant for creating dashboards, you can do much more than that using the tool. It can be particularly useful in the health and manufacturing sectors for analytics. It also lets you develop customized dashboards for data tracking. The dashboard tool in it is quite intuitive, and you also get interactive data visualization widgets. The tool can be useful for any industry. DataWrapper Businesses looking for a robust and feature-laden data visualization tool for making different types of tables, charts, maps can use DataWrapper. It lets you create intuitive and mobile-friendly charts. With it, you can also create customizable maps. The tool is useful for various types of users, including students, marketers and journalists. Even if you lack skill in design and coding, you can develop impressive visual graphs and charts using the tool. DataWrapper offers a free plan that actually packs in many useful features. More demanding users can opt for the Enterprise plan. Microsoft Power BI Microsoft has many tools that can be useful for data analysis, but Power BI has become very popular with businesses delving into business intelligence and data visualizations. With this tool, you can analyze data on-premise and also on the cloud-as per the needs. You get plenty of dashboards and interactive report creation features in the tool. The tool is also compatible with widely used Microsoft applications like Excel and many other third-party online services and applications. This makes data gathering simple. Its data sharing and exporting features are also robust. You can make use of the Power BI desktop, and there are other versions, too. Its popularity has prompted many businesses to look for power bi analysis services. You can try the free version and then switch to the paid ones. Summing it up There are many other data visualization and BI solutions you can pick from nowadays. However, it is necessary to analyze a few factors before buying any such tool or hiring a power bi designer. You have to think of the existing IT infrastructure used in your home or office to begin with. Power BI desktop, for example, runs only on Windows PCs. Checking the feature set and its viability is also important. The support option offered by the vendors is also important in this regard. Source: Voticle