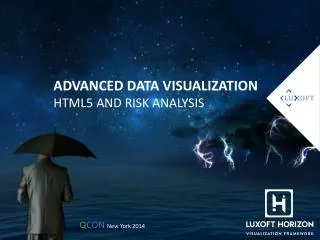
Advanced Visualization Techniques for Big Data
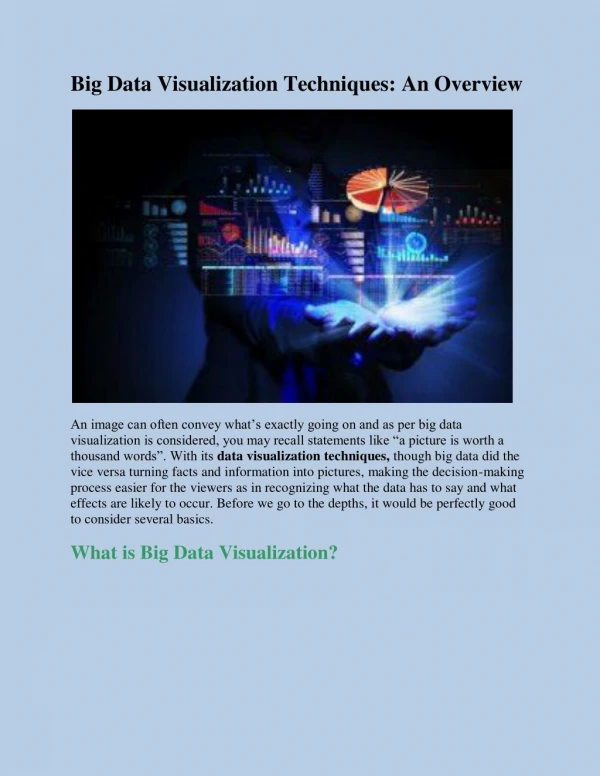
Explore the power of Graph Thinking Themes to create impactful visualizations and reveal the true narrative behind big data. Discover strategies to improve graph construction, storytelling, and interactive sharing. Uncover the significance of less elaborate graphs and smart graphing elements for effective data communication.

Advanced Visualization Techniques for Big Data
E N D
Presentation Transcript
Advanced Visualization Techniques for Big Data Scott Lee Wise JMP GBPI & Training Manager SAS Institute, Inc. Austin, TX 05/23/19
Adv Viz for Big Data Words of Inspiration From The Experts “Purpose of graphing is to start a conversation” Alberto Cairo, Professor of Professional Practice, Knight Chair in Visual Journalism, University of Miami “All graphs are wrong, but some are useful” Xan Gregg – JMP Director, Research & Development – SAS Institute, Inc. - Cary, NC
Adv Viz for Big Data Why We Are Here? Problem: Even with access to good visualization software, graphing is done too quickly and haphazardly without proper “thought” to purpose and construction. Big data sizes amplify these problems and this results in ineffective graphing. Answer: Proper “Graph Thinking Themes” can help you create more effective visualizations that convey your intended message and can bring out the “real story” in your big data. source: pexels.com
Adv Viz for Big Data Solution We will not be focusing on normal graphing advice on how to best prepare and subgroup your data, pick the right graph types per data type, or even choose the best visualization software to use. Instead we will focus on just four “Graph Thinking” Themes that the our experts say are even more important to ask as we build our big data graphs! • Graph Thinking Themes • 1) Area We Graphing Information or Just Data? • Uncover Generalizations, Tell the Real Story • 2) Are We Over Elaborating our Graphs? • Less is More • 3) Are We Using Smart Graphing Elements? • Coloring, Labels, Markers, Etc. • 4) Area We Enabling Interactive Sharing? • Filtering, Linking, Dashboarding, Etc.
Adv Viz for Big Data Point 1) Graphing Information or Just Data? 1) Area We Graphing Information or Just Data? • Uncover Generalizations • Tell the Real Story! Example: “The Truth Texas About the Texas Bluebonnet Rattlesnake” – Scott Wise community.jmp.com - The Truth About the Texas Bluebonnet Rattlesnake
Adv Viz for Big Data Point 2: Less Is More 2) Are We Over Elaborating Our Graphs? • Don’t Obscure the Message – Less is More! • Common Offender Graph Types: Pie Charts, 3D Bar Charts, etc. • Beware Too Much Wordage – “No One Reads the Footer!” Example: “Better Late Than Never – Remaking Pie Charts for Pi Day” – Xan Gregg community.jmp.com - Better Late Than Never Remaking Pie Charts for Pi Day
Adv Viz for Big Data 3) Are We Using Smart Graphing Elements? • Coloring • Overlays • Markers Example: From Blog: “Are UFO Sightings Increasing” – Scott Wise & Samantha Wise community.jmp.com/Are UFO Sightings Increasing and What Does This Mean for Texan BBQ and Boots? 3) MAKE USE OF SMART GRAPHING ELEMENTS
Adv Viz for Big Data 4) Area We Enabling Interactive Sharing? • Create Dashboard Views • Link Your Graph to Data Filters or Even Other Graphs • Make Accessible Over Shared Sites Example: From Blog: “How Domestic is My Car?” – Scott Wise public.jmp.com - How Domestic Is My Car 4) ENABLE INTERACTIVE SHARING
Adv Viz for Big Data Bonus: Where is Graphing Going in the Future? • Graphs in Graphs • More Animated Graphs Example: “Soy What? Where is the Wheat?” – Scott Wise community.jmp.com - Soy What? Where is the Wheat? Future Of Graphing
Adv Viz for Big Data Recap Thank You for Your Time and Have Fun Graphing! • General Graphing Themes • 1) Graphing Information or Just Data? • Uncover Generalizations, Tell the Real Story • 2) Less is More! • Don’t Over Elaborate Graphs • 3) Use of Smart Graphing Elements • Coloring, Labels, Markers, Etc. • 4) Enable Interactive Sharing • Filtering, Linking, Dashboarding, Etc.
Adv Viz for Big Data References / Where to Learn More Alberto Cairo, Professor of Professional Practice, Knight Chair in Visual Journalism, University of Miami • Webcast (community.jmp.com): "How Charts Lie and How They Make Us Smarter” • Latest Book: The Truthful Art: Data, Charts, and Maps for Communication Xan Gregg – JMP Director, Research & Development – SAS Institute, Inc. - Cary, NC • Webcast (community.jmp.com): "All Graphs are Wrong but Some are Useful” • Twitter Campaign: Progress on OneLessPie