7 popular data visualization libraries by Python in 2021
Learn here some of Pythonu2019s most popular data visualization libraries large dataset visuals such as infographics, graphs, and plots.

7 popular data visualization libraries by Python in 2021
E N D
Presentation Transcript
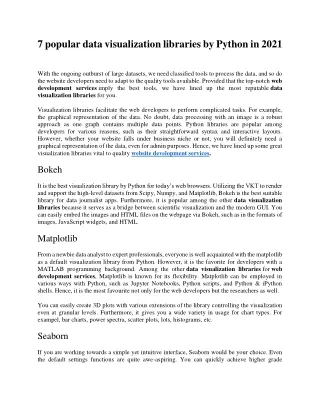
7 popular data visualization libraries by Python in 2021 With the ongoing outburst of large datasets, we need classified tools to process the data, and so do the website developers need to adapt to the quality tools available. Provided that the top-notch web development services imply the best tools, we have lined up the most reputable data visualization libraries for you. Visualization libraries facilitate the web developers to perform complicated tasks. For example, the graphical representation of the data. No doubt, data processing with an image is a robust approach as one graph contains multiple data points. Python libraries are popular among developers for various reasons, such as their straightforward syntax and interactive layouts. However, whether your website falls under business niche or not, you will definitely need a graphical representation of the data, even for admin purposes. Hence, we have lined up some great visualization libraries vital to quality website development services. Bokeh It is the best visualization library by Python for today’s web browsers. Utilizing the VKT to render and support the high-level datasets from Scipy, Numpy, and Matplotlib, Bokeh is the best suitable library for data journalist apps. Furthermore, it is popular among the other data visualization libraries because it serves as a bridge between scientific visualization and the modern GUI. You can easily embed the images and HTML files on the webpage via Bokeh, such as in the formats of images, JavaScript widgets, and HTML. Matplotlib From a newbie data analyst to expert professionals, everyone is well acquainted with the matplotlib as a default visualization library from Python. However, it is the favorite for developers with a MATLAB programming background. Among the other data visualization libraries for web development services, Matplotlib is known for its flexibility. Matplotlib can be employed in various ways with Python, such as Jupyter Notebooks, Python scripts, and Python & iPython shells. Hence, it is the most favourite not only for the web developers but the researchers as well. You can easily create 3D plots with various extensions of the library controlling the visualization even at granular levels. Furthermore, it gives you a wide variety in usage for chart types. For exampel, bar charts, power spectra, scatter plots, lots, histograms, etc. Seaborn If you are working towards a simple yet intuitive interface, Seaborn would be your choice. Even the default settings functions are quite awe-aspiring. You can quickly achieve higher grade
visualizations with Seaborn by writing minimal codes. Furthermore, it supports various complex plots such as distribution, categorical, swarm plots, etc. Seaborn is stacks upon the matplotlib, which makes it highly compatible with matplotlib. Hence, you can imply these plots and customize them with matplotlib. Altair This library is the most popular of the data visualization libraries among researchers and journalists. If your website depicts large amounts of data, such as global statistics, your web development services providermust ensure that you have a suitable library implied. Altair works the best to showcase patterns and relationships within the data. It uses declarative formats for creating the plots, making the iteration via visualization a rapid process. Hence, if you have large datasets to be depicted on your website, you must ensure that you have joined hands with a top-notch web development agency such as Navicosoft. Plotly Ploty stands out of the other libraries for its interactivity. If you wish to follow the ongoing trends in the website development services such as interactive website dev and design, Plotly is the library of your choice. The best features of plotly is its compatibility with web browsers, which makes sharing the plots among colleagues very easy. Furthermore, the plotly plots may support the animation effects as well. Hence, it would be pretty fun, and you must check it out! Dash It is more like a do-it-yourself library, most loved by professionals who understand the Python ecosystem very well. You can select any Python-based dataset with Dash. It can provide you witht an output that may be interactive or visual with the best customizable tools. ggplot The last entry of our list of the best data visualization libraries is the ggplot. It is a Python version for the ggplot2 of Grammer of graphics language and R. If you are already familiar with its usage in R, it will be the most straightforward library for plots. Apart from being flexible, ggplot is a declarative library. Furthermore, it is coupled with Pandas, making it even more suitable for all the libraries to create the visualizations with the Pandas data frames.
In short, all the data visualization libraries havetheirfeatures, pros, and limitations. Hence, the choice of the right data visualization library is vital to the quality analysis of datasets. Therefore, you must be wary of your choice of the web development services provider who must ensure that you have the best suitable libraries incorporated in your website, fulfilling your requirements and preferences for the output and functionalities. #DataVisualizationLibraries, #PythonLibraries, #PythonDataVisualizationLibraries, #WebDevelopment,