Download
1 / 4
40 likes | 58 Views
In the world of the cut-throat competitive world, businesses that have discovered the mantra of effective information and data management will only prosper. Though the job is wearisome, it is imperative. Thanks to technology that has to reduce the complexities in information & data management by granting businesses a tool like a dashboard. Dashboard, a product of high-end technology, helps businesses to gain an in-depth understanding of metrics and crucial information while leveraging the power of decision-making. The effective use of a data analytics & visualization dashboard has a certain impact on business productivity, ROI, and maximum use of in-hand data. However, this can only be accomplished if the at-service dashboard is purpose build and have the right metrics. In this post, we will cover details like what is data analytics and visualization dashboard, the advantages of using one, ways to pick key metrics, etc.<br><br>

E N D
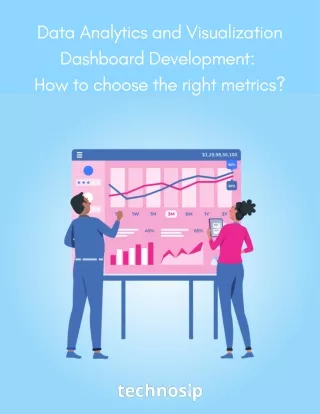
Data Analytics and Visualization Dashboard Development: How to choose the right metrics?
In the world of the cut-throat competitive world, businesses that have discovered the mantra of effective information and data management will only prosper. Though the job is wearisome, it is imperative. Thanks to technology that has to reduce the complexities in information & data management by granting businesses a tool like a dashboard. Dashboard, a product of high-end technology, helps businesses to gain an in-depth understanding of metrics and crucial information while leveraging the power of decision-making. The effective use of a data analytics & visualization dashboard has a certain impact on business productivity, ROI, and maximum use of in-hand data. However, this can only be accomplished if the at-service dashboard is purpose build and have the right metrics. In this post, we will cover details like what is data analytics and visualization dashboard, the advantages of using one, ways to pick key metrics, etc.
Understanding the Meaning of Dashboards for Businesses Before we delve deep into details, let’s learn about dashboard meaning. Designed to provide a super-quick (and yet detailed) view of key performance indicators of a given business ecosystem, a dashboard is a business intelligence and information tool. It is like a comprehensive snapshot of a business representing all the quintessential information. Its nature is dynamic, and its job is to keep pivotal and result- oriented information at a one-click away. By sorting out all the collected information, a dashboard leverages the information management job at multiple levels. There are versatile kinds of dashboard, and each one suffices a particular purpose. Our prime focus is on data analytics and visualization dashboard. This variety of dashboard is a reporting tool capable of recording, tracking, assessing, evaluate, and display the KPIs along with data points. It can concoct a large volume of data in the blink of an eye in order to predict market trends, find out insights, and design a business strategy. To represent the analyzed data, it uses means like pie charts, graphs, tables, gauges, and other graphical representation devices.
The advanced BI features, e.g., drill-down and ad-hoc querying, are distinctive traits of a data analytics and visualization dashboard. You may take the example of the MRR/Accounts dashboards to understand their concept well, as it is a lightweight version of an analytical dashboard. The Edge of Using Data Analytics and Visualization Dashboard Out of all the BI tools, the dashboard has garner special importance when leveraged data management. More and more growth-specific businesses are using it. The current market trends are enough to prove it. In 2017, the market value of dashboard software was calculated to USD 2,296 million. Read more... If you want to develop customized dashboard then, get in touch at info@technosip.com. Explore our Web Development Services.