Download
1 / 16
160 likes | 338 Views
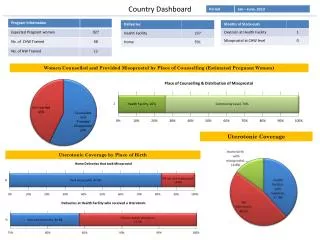
Dashboard Metrics. Presented by: Lita Marishak Robert Mosser. Visual Presentation of Metrics. Communicate large amounts of data within a small space and time frame Quick presentation of data with comparisons Clear and accurate presentation Allow ease of understanding

E N D
Dashboard Metrics Presented by: Lita Marishak Robert Mosser ASEE Workshop
Visual Presentation of Metrics • Communicate large amounts of data within a small space and time frame • Quick presentation of data with comparisons • Clear and accurate presentation • Allow ease of understanding • Common, easy-to-understand format • “Everyday” feel to the presentation • Facilitate decision-making • Objective data with comparisons • Timely and accurate information • Gain economic acceptance for current and future efforts • Real dollar impact/benefit presentation • Excellent format for check signers, bean-counters, those with something to gain from saving or spending money more wisely ASEE Workshop
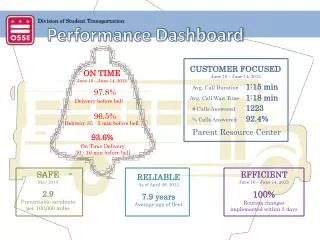
Expected A Dashboard Example: Graphics Indicator Light Traffic Signal Meter/Gauge Pie Chart Line Graph Bar Graph Column Bar Graph ASEE Workshop
A Dashboard Example: Categories • Performance/Status • Coverage • Completion • Productivity • Quality ASEE Workshop
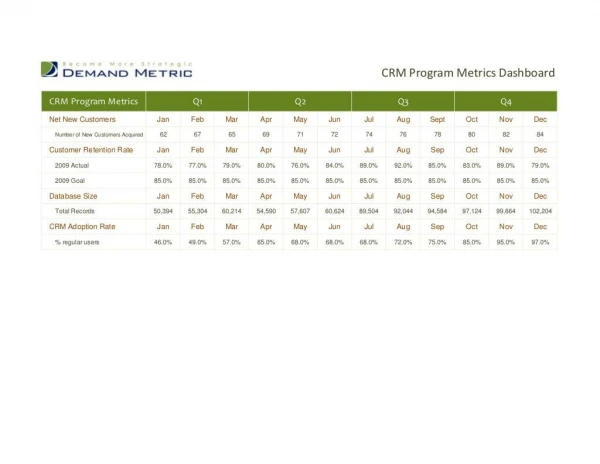
A Dashboard Example: Performance/Status Section BOGUS PRODUCT 2, Ver. 2.5 Status From To Reporting Period 11/6/2000 12/7/2000 Expected Expected 1. Defects Found Defects 310% Found Expected 2. Test Cases Successfully Run Test Cases 100% Complete 9/18 Weeks 3. Elapsed Time 306.7% Spent 10/27 Cumulative This Period Remaining ASEE Workshop
Effective Do’s and Don’ts • DO • Present the data and tell the truth • Emphasize substance instead of methodology or the graphic design • Reveal the data at several levels: from broadto the detail • Use accurate comparisons • Provide the greatest amount of data with the least amount of ink in the smallest space • Represent numbers and the corresponding graphic sizes in the same proportions • Show data variation ASEE Workshop
Effective Do’s and Don’ts (con’t) • DON’T • Let the information lie • Get graphically complicated • Show design variation • Forget to label the data right on the graphic • Distort the visual representationof the data • Forget to provide actual numbers used to create the graphics ASEE Workshop
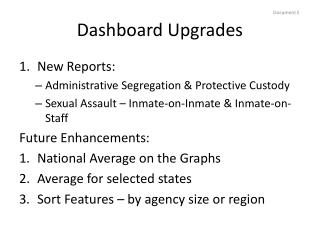
Conclusion • Benefits • Client Acceptance • Next Steps ASEE Workshop
Edward R. Tufte, The Visual Display of Quantitative Information, 1983, Graphics Press Edward R. Tufte, Envisioning Information, 1990, Graphics Press Edward R. Tufte, Visual Explanations, 1997, Graphics Press Ben Schneiderman, Designing the User Interface, 3rd Edition, 1998 Laura Arlov, GUI Design for Dummies, 1997 Darrell Huff, How to Lie with Statistics, 1954 Elizabeth Linkdholm, Information Center, August, 1987, “There’s More to Graphics than Making Pretty Pictures. It’s Called Analysis” Lloyd Dobyns and Clare Crawford-Mason, Thinking About Quality: Progress, Wisdom, and the Deming Philosophy, 1994 A. J. Cameron, A Guide to Graphs, 1970 William S. Cleveland, The Elements of Graphing Data, 1985 Allan C. Haskell, How to Make and Use Graphic Charts, 1920 Robert L. Harris, Information Graphics: a Comprehensive Illustrated Reference,1996 Mary Eleanor Spear,Practical Charting Techniques, 1969 Jan V. White, Using Charts and Graphs, 1000 Ideas for Visual Persuasion, 1984 References ASEE Workshop
Supplementary Materials • Related Data Sheets for Example Dashboard • Additional Dashboard Example • Related Data Sheets ASEE Workshop
Req'mnts Design Code Test Creation 0 0 0 0 Execution 1 0 473 0 Rework Lost Work % Rework & Lost 59.2 11.4 29.4 WIN NT WIN 98 WIN 95 600 300 300 IE (5.0) Netscape Win NT Win 98 Win 95 654 538 612 232 232 Expected Actual Completed Win NT 600 728 489 Win 98 300 232 232 Win 95 300 232 232 1. Defects Found BOGUS PRODUCT 2 DASHBOARD DATA SHEET --THIS PERIOD--Create Execute Total Expected 0 171 Actual 0 812 Total Overdue (Cumulative) 0 0 Total Expected is the number of test cases that were estimated to be created or executed during this reporting period. Actual is the number of test cases that were created or executed during this reporting period. Total Overdue is the sum of the number of test cases expected to be created or executed 1200 Expected - 1192 Created up to and including this reporting period less the total number of test cases actually created or executed up to and including this reporting period. 1192 Test Cases - 1192 Completed Expected 20 13. Defects by Status and Priority 2. Test Cases Run Expected 1200 16. Q/A Rework by Caused and Q/A Phases 3. Time Spent 14. % Rework and Lost Hours Expected 6 4. Expected Test Cases by OS Rework 474 hours Lost Time 91 Work 235 8. Expected Test Cases by Browser 9. Actual Test Cases by Browser 5. Actual Test Cases by OS 17. Defects by Status and Q/A Phase 11. Test Case Execution Status
Funct/Struc MDAC Environ. 340 90 540 BOGUS PRODUCT 2 DASHBOARD DATA SHEET Page 2 6. Expected Test Cases by Functionality 7. Actual Test Cases by Functionality 10. QA Creation Statistics 12. QA Execution Statistics 15. Expected vs. Found Defects 18. Defects by Caused Phase &Component
1. Defects Found BOGUS PRODUCT 1, 3.005 DASHBOARD DATA SHEET Total Expected is the number of test cases that were estimated to be created or executed during this reporting period. Actual is the number of test cases that were created or executed during this reporting period. Total Overdue is the sum of the number of test cases expected to be created or executed up to and including this reporting period less the total number of test cases actually created or executed up to and including this reporting period. --THIS PERIOD-- Create Execute Total Expected 150 1637 Actual 150 1637 Total Overdue (Cumulative) 0 0 150 Expected - 150 Created 1637 Expected - 1637 Executed Expected 20 2. Test Cases Run 8. Test Case Execution Status 14. Expected vs. Found Defects Expected 2008 3. Time Spent 12. Defects by Status & Severity 6. Expected Test Cases by Priority 7. Actual Test Cases by Priority Expected 5 4. Expected Test Cases by Type 5. Actual Test Cases by Type 11. Percent Rework Hours Rework 8 hours Lost Time 0 Work 136 13. Q/A Rework by Caused and Q/A Phases 15. Defects by Status and Q/A Phase
BOGUS PRODUCT 1 , 3.005 DASHBOARD DATA SHEETPage 2 9. Test Case Creation Statistics 10. Test Case Execution Statistics 16. Defects by Caused Phase & Component ASEE Workshop