Download
1 / 5
50 likes | 69 Views
Stability and functionality of equipment is highly dependent on the process variables and inherent response of the system elements to changes in the same. Equipment is designed considering certain known risks so that slight deviation in the process variables should not hinder the functioning largely. In case of solar power plants, the key risk areas hindering the power output are cloud cover, untidy surfaces of solar panels and short circuits due to overheating at scattered locations. But in addition to these, solar eclipse is a rarely occurring event which has the potential to cause severe damages to the power plant. According to an established theory, during the eclipse, there is a stall in the power output as the solar radiation is covered by the moon but as the eclipse passes the totality, one can expect a sudden surge in the incoming solar radiation which bears the potential to destabilize the power generation system. This paper intends to validate the theory by quantification and analysis of data collected during a solar eclipse in the yesteryear. The data collected during the eclipse will be compared to that collected on a consecutive day without an eclipse to confirm the surge in solar radiation once the eclipse totality is passed. This data can be helpful for solar power plant design, selection according to power generation capacity and occupational equipment safety in context of emergency preparedness and response. Gourav Vivek Kulkarni "Validation of Theory of Qualitative Effect of Total Solar Eclipse on Power Generation of Solar Power Plant" Published in International Journal of Trend in Scientific Research and Development (ijtsrd), ISSN: 2456-6470, Volume-4 | Issue-4 , June 2020, URL: https://www.ijtsrd.com/papers/ijtsrd31541.pdf Paper Url :https://www.ijtsrd.com/engineering/mechanical-engineering/31541/validation-of-theory-of-qualitative-effect-of-total-solar-eclipse-on-power-generation-of-solar-power-plant/gourav-vivek-kulkarni<br>

E N D
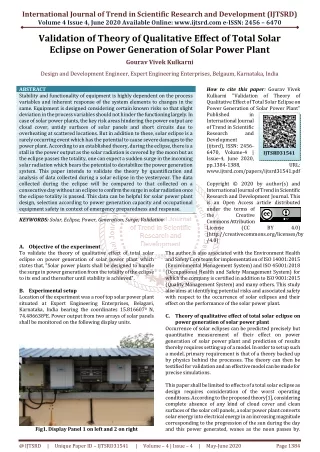
International Journal of Trend in Scientific Research and Development (IJTSRD) Volume 4 Issue 4, June 2020 Available Online: www.ijtsrd.com e-ISSN: 2456 – 6470 Validation of Theory of Qualitative Effect of Total Solar Eclipse on Power Generation of Solar Power Plant Gourav Vivek Kulkarni Design and Development Engineer, Expert Engineering Enterprises, Belgaum, Karnataka, India ABSTRACT Stability and functionality of equipment is highly dependent on the process variables and inherent response of the system elements to changes in the same. Equipment is designed considering certain known risks so that slight deviation in the process variables should not hinder the functioning largely. In case of solar power plants, the key risk areas hindering the power output are cloud cover, untidy surfaces of solar panels and short circuits due to overheating at scattered locations. But in addition to these, solar eclipse is a rarely occurring event which has the potential to cause severe damages to the power plant. According to an established theory, during the eclipse, there is a stall in the power output as the solar radiation is covered by the moon but as the eclipse passes the totality, one can expect a sudden surge in the incoming solar radiation which bears the potential to destabilize the power generation system. This paper intends to validate the theory by quantification and analysis of data collected during a solar eclipse in the yesteryear. The data collected during the eclipse will be compared to that collected on a consecutive day without an eclipse to confirm the surge in solar radiation once the eclipse totality is passed. This data can be helpful for solar power plant design, selection according to power generation capacity and occupational equipment safety in context of emergency preparedness and response. KEYWORDS: Solar, Eclipse, Power, Generation, Surge, Validation How to cite this paper: Gourav Vivek Kulkarni "Validation of Theory of Qualitative Effect of Total Solar Eclipse on Power Generation of Solar Power Plant" Published in International Journal of Trend in Scientific Research and Development (ijtsrd), ISSN: 2456- 6470, Volume-4 | Issue-4, June 2020, pp.1384-1388, www.ijtsrd.com/papers/ijtsrd31541.pdf Copyright © 2020 by author(s) and International Journal of Trend in Scientific Research and Development Journal. This is an Open Access article distributed under the terms of the Creative Commons Attribution License (CC (http://creativecommons.org/licenses/by /4.0) IJTSRD31541 URL: BY 4.0) A.Objective of the experiment To validate the theory of qualitative effect of total solar eclipse on power generation of solar power plant which states that, "Solar power plants shall be designed to handle the surge in power generation from the totality of the eclipse to its end and thereafter until stability is achieved". B.Experimental setup Location of the experiment was a roof top solar power plant situated at Expert Engineering Enterprises, Belagavi, Karnataka, India bearing the coordinates 15.8166070 N, 74.4866380E. Power output from two arrays of solar panels shall be monitored on the following display units. The author is also associated with the Environment Health and Safety Core team for implementation of ISO 14001:2015 (Environmental Management System) and ISO 45001:2018 (Occupational Health and Safety Management System) for which the company is certified in addition to ISO 9001:2015 (Quality Management System) and many others. This study also aims at identifying potential risks and associated safety with respect to the occurrence of solar eclipses and their effect on the performance of the solar power plant. C.Theory of qualitative effect of total solar eclipse on power generation of solar power plant Occurrence of solar eclipses can be predicted precisely but quantitative measurement of their effect on power generation of solar power plant and prediction of results thereby requires setting up of a model. In order to set up such a model, primary requirement is that of a theory backed up by physics behind the processes. The theory can then be testified for validation and an effective model can be made for precise simulations. This paper shall be limited to effects of a total solar eclipse as design requires consideration of the worst operating conditions. According to the proposed theory[1], considering complete absence of any kind of cloud cover and clean surfaces of the solar cell panels, a solar power plant converts solar energy into electrical energy in an increasing magnitude corresponding to the progression of the sun during the day and this power generated, wanes as the noon passes by. Fig1. Display Panel 1 on left and 2 on right @ IJTSRD | Unique Paper ID – IJTSRD31541 | Volume – 4 | Issue – 4 | May-June 2020 Page 1384
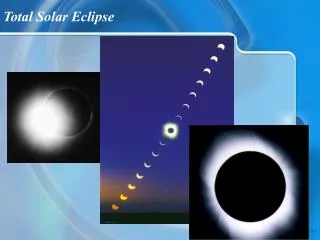
International Journal of Trend in Scientific Research and Development (IJTSRD) @ www.ijtsrd.com eISSN: 2456-6470 However, during a total solar eclipse, irrespective of the time of the day, once the apparent diameter of the moon starts to cover the apparent diameter of the sun, up to the totality of the eclipse, the incoming radiation incident on the solar panels stalls and attains minima at the eclipse totality. As the totality is passed, the apparent diameter of the moon starts to uncover the apparent diameter of the sun and a surge in the incoming radiation incident on the solar panels can be observed. This gush of radiation is predicted to be higher than what would have been incident on a regular day without eclipse at any given time during the period of eclipse. Thus although the solar power plant may be designed for a certain maximum incident radiation, additional design safety needs to be considered while tackling situations like a solar eclipse wherein within a small period of time, intensity of incident radiation can cause system failure in terms of overheating, short circuit and imbalance of power grid to which the power is been supplied. To summarize, as the eclipse begins, there is a stall in the power generation which reaches minimum during totality and as the eclipse proceeds from totality to its end, there is a surge in the power generation which needs control by means of design for grid stability. D.Need for Quantitative validation of theory William Thomson (1824-1907), also known as Lord Kelvin has said, "I often say that when you can measure what you are speaking about, and express it in numbers, you know something about it; but when you cannot measure it, when you cannot express it in numbers, your knowledge is of a meagre and unsatisfactory kind; it may be the beginning of knowledge, but you have scarcely, in your thoughts, advanced to the stage of science, whatever the matter may be." Thus in order to validate the proposed theory, it is necessary to have a quantitative validation of the same to support the qualitative ideas. Comprehension of the theory can be much easily facilitated when it is backed up with numbers and graphs depicting trends. D.A. Governing variables Like every experiment, this experiment too has a certain number of governing variables, prominent of which are explained as follows. The first variable is the surface of the solar panel. Accumulation of dust or any other foreign particles can block significant amount of radiation incident on them. In order to obtain optimum results, the solar panel surface should be clean. However, in event this cannot be facilitated, to maintain continuity, the experiment duration can be kept short with the surface undisturbed. The second variable is that of cloud cover. Cloud cover can cause variation in the incoming radiations and can render hindrance to the smooth functioning of the power plant. The ideal condition is that of a clear sky. On the day of the experiment the sky was clear in the eastern side where the eclipse occurred and the western sky was observed to have Altocumulus clouds. By this the experiment was not hindered by cloud cover [2]. The third variable is overall system maintenance. All mechanical parts and electrical connections need to be maintained to deliver the rated power corresponding to the incoming solar radiation which was ensured during the experiment. The fourth and final prominent variable is that of the recording of readings by the observer. It is highly recommended that the same observer records all the readings and observes the display panel at the prescribed intervals of time without any delay. In event the display is in the form of gauges, parallax errors should strictly be avoided by marking the location of the observer. Digital display of the power generated can help to get accurate readings. In addition to this there are other governing variables like location at which the experiment is conducted, altitude, whether forecast, relative humidity and so on. Since the experiment is being conducted at the same location, little consideration will show that these additional variables do not largely hinder the experimental results. D.B. Solar Eclipse of 26 December 2019 An annular total solar eclipse was chosen for the experiment as results of partial eclipse may not completely depict the maxima of incoming radiation [3]. The eclipse started at the location at 0804 hrs, reached totality at 0924 hrs and ended at 1101 hrs. Following images have been taken from the stated reference for better understanding [4]. Fig2. Start of eclipse at 0804 hrs [4] Fig3. Totality of eclipse at 0924 hrs [4] Fig4. End of eclipse at 1101 hrs [4] @ IJTSRD | Unique Paper ID – IJTSRD31541 | Volume – 4 | Issue – 4 | May-June 2020 Page 1385
International Journal of Trend in Scientific Research and Development (IJTSRD) @ www.ijtsrd.com eISSN: 2456-6470 The experiment was started at 0910 hrs as the eclipse was reaching totality since stall in incoming solar radiation does not cause any pronounced instability in the power generation as that caused due to a surge in the incoming radiation as the eclipse moves from totality towards its end. As seen in Fig3, although an annular eclipse was not observed, a little consideration with show that the visible crescent of the sun can mathematically be developed into an annulus and the incoming radiation thereby can be considered as nearly equal to that incident from an annular total solar eclipse. D.C. Experimental Procedure An experiment needs to be designed such that it is self sufficient as well as comparable with other similar experiments[5]. It should ensure repeatability when similar process parameters governing the experiment are reproduced either naturally or artificially. The experimental procedure should be feasible to be performed with the required equipment and skills. For any experiment, an outcome is guaranteed, it may be favourable or otherwise solely dependent on the perspective. The following general Experimental procedure has been suggested [1]. Step 1 : On the day of a total solar eclipse, start monitoring the power generated by the solar plant from the beginning of the eclipse Step 2 : During totality, note down the power generated as this is theoretically the lowest of the day of eclipse Step 3 : Note the power generated as the moon uncovers the sun to get the quantization of the surge in incoming radiation Step 4 : On the very next day, repeat the procedure at the exact time as that of the eclipse day Step 5 : Compile the data and compare the same E.Results and discussions On the day of eclipse, the data collection was started at 0910 hrs while the eclipse was proceeding towards totality. Two LCD displays as shown in Fig. 1 were monitored and for every five minutes, the observed reading was noted. The process of noting down the readings was concluded with the reading taken at 1100 hrs which marked the end of the eclipse. During this process, the author himself noted all the readings while Mr. Bhalchandra Bailur, GM (Technical) and Environmental Health and Safety Core Team Member and Mr. Anand S Chamakeri (Design Engineer), Expert Engineering Enterprises, witnessed a few readings and gave their suggestions regarding the design of the experiment. In the following sections, four types of comparative analyses have been done. Experimental results have been presented in the form of graphs only and no numerical data has been shared in order to maintain secrecy of company specific data. In the graphs, the abscissa represents the nth reading starting with the first reading taken at 0910 hrs and with every consecutive reading taken after five minutes thus marking the last reading taken at 1100 hrs as the 23rd reading. E.A. Comparison of trends of both the display panels on eclipse day Following figure depicts the comparison of trends of both the display panels on eclipse day Fig5. Comparison of trends of both the display panels on eclipse day The figure depicts a plot of power output in kW on the ordinate against the reading number on the abscissa thereby comparing the readings obtained from both the displays. The displays are connected to different arrays of solar panels and comparison of the trends of both the displays provides a premise that the readings obtained represent faithful data since the trends of both the curves are similar. It can be observed from the plot that the overall trend of both the curves is similar which establishes the fact that readings are faithful and the data can be processed for analysis. As the eclipse advances towards totality, the trends of both the curves are decreasing in nature depicting reduction in power output. At the totality of the eclipse, which corresponds to reading number four, minimum power output has been registered by the system. Thereafter, in accordance with the theory proposed that there is a surge in power output; both the curves depict an increasing trend with minor system instabilities which show that the incoming radiation is not uniform. There may be losses due to local convection currents on account of winds which were not prominent but might have existed feebly on the day of the experiment at higher altitudes. Minima observed for Display 1 is around 1.6 kW while that observed for display 2 is around 0.7 kW. The maxima observed at the end of the eclipse for display 1 is 46.2 kW while that for display 2 is 22 kW. This indicates a surge of 44.6 kW and 21.3 kW respectively for both the displays within a short span of 95 minutes. This shall be compared with the trends observed on a regular day for validation of the theory. E.B. Comparison of trends of both the display panels on regular day Following figure depicts the comparison of trends of both the display panels on regular day Fig6. Comparison of trends of both the display panels on regular day @ IJTSRD | Unique Paper ID – IJTSRD31541 | Volume – 4 | Issue – 4 | May-June 2020 Page 1386
International Journal of Trend in Scientific Research and Development (IJTSRD) @ www.ijtsrd.com eISSN: 2456-6470 The figure depicts a plot of power output in kW on the ordinate against the reading number on the abscissa thereby comparing the readings obtained from both the displays. The displays are connected to different arrays of solar panels and comparison of the trends of both the displays provides a premise that the readings obtained represent faithful data since the trends of both the curves are similar. It can be observed from the plot that the overall trend of both the curves is similar which establishes the fact that readings are faithful and the data can be processed for analysis. On the very next day, the readings were noted down similarly for both the displays. As a corollary to the theory, there should not be any pronounced surge in power output on a regular day. This can be observed from the plot. There is an overall steady increase in the power generation as the day progresses. This indicates that qualitatively, the theory is validated. Numerical comparison can further aid complete validation. At the 4threading corresponding to the totality of the eclipse on the previous day, power output observed for Display 1 is around 17.4 kW while that observed for display 2 is around 8.9 kW. At the 23rd reading corresponding to the end of the eclipse, power output for display 1 is 27.6 kW while that for display 2 is 15.2 kW. This indicates an increase of 10.2 kW and 6.3 kW in a span of 95 minutes. Thus it is clear that on the day of eclipse, there was around four times intense radiation incident on the power plant within a short span of 95 minutes from the totality of the eclipse to its end. Thus the theory is quantitatively validated, that after totality, there is a surge in the incoming solar radiation on the day of an eclipse compared to a regular day. This shall be compared further for individual displays for confirmation. E.C. Comparison of consecutive days' data for display 1 Following figure depicts comparison of consecutive days' data for display 1 It can also be observed that beyond the point of crossing of the curves, the curve depicting readings taken on a regular day continues to increase at a steady slope which is apparently lesser compared to that indicating readings taken on the day of eclipse. This validates the fact that there is certainly a surge in incoming solar radiation that needs to be considered while designing the safety equipment and load distribution and balance unit. E.D. Comparison of consecutive days' data for display 2 Following figure depicts comparison of consecutive days' data for display 2 Fig8. Comparison of consecutive days' data for display2 The figure depicts a plot of power output in kW on the ordinate against the reading number on the abscissa. On comparison, it can be seen that the curve depicting the readings taken on the day of the eclipse has an overall steeper slope compared to that depicting the readings taken on a normal day. There is a point where the crossing of the curves takes place somewhere between the 15th and 17th readings. This crossing of curves can provide further data regarding the effective additional heat flux incident on the power plant. It can also be observed that beyond the point of crossing of the curves, the curve depicting readings taken on a regular day continues to increase at a steady slope which is apparently lesser compared to that indicating readings taken on the day of eclipse. There are variations in the slope of eclipse day curve which can be attributed to large variations in the incoming radiation. This validates the fact that there is certainly a surge in incoming solar radiation that needs to be considered while designing the safety equipment and load distribution and balance unit. Thus the theory is validated for cross comparison of data from different displays and that recorded on different days. F.Applicability of the validated theory This theory can be used as a key guideline while designing the solar power plant, power distribution unit and the solar panels themselves. There may be a safer option of turning off the solar power plant from the totality until the incoming radiation is stabilized, but if there is additional energy, the best thing would be to harness it in an effective manner so as to replenish the requirements of larger masses. Potential risks include short circuits, unstable power output and failure of connected electrical equipment. Switching circuits can be designed to distribute the additional power Fig7. Comparison of consecutive days' data for display1 The figure depicts a plot of power output in kW on the ordinate against the reading number on the abscissa. On comparison, it can be seen that the curve depicting the readings taken on the day of the eclipse has an overall steeper slope compared to that depicting the readings taken on a normal day. There is a point where the crossing of the curves takes place somewhere between the 15th and 17th readings. This crossing of curves can provide further data regarding the effective additional heat flux incident on the power plant. @ IJTSRD | Unique Paper ID – IJTSRD31541 | Volume – 4 | Issue – 4 | May-June 2020 Page 1387
International Journal of Trend in Scientific Research and Development (IJTSRD) @ www.ijtsrd.com eISSN: 2456-6470 only during such surges as occurrence of solar eclipse is rare and the time is known well in advance. Further, a correlation can be developed to determine the numerical value in surge in the incoming radiation and corresponding effects on power generation which can be a function of location, altitude, time of occurrence of eclipse and all other such parameters. Conclusion Thus it can be concluded that the theory of effect of total solar eclipse on power generation of solar power plant which states, "Solar power plants shall be designed to handle the surge in power generation from the totality of the eclipse to its end and thereafter until stability is achieved" is validated by the experimental procedure and results thereof backed with the physics behind each argument stated and explained herein. Acknowledgement The author extends his sincere regards and thanks to Mr. Vinayak Lokur, CEO, Expert Engineering Enterprises for having permitted to carry out this analysis and encouragement from time to time. The author also thanks Mr. Bhalchandra V Bailur, GM (Technical) and Mr. Anand S Chamakeri, Design Engineer for witnessing part of the experimental procedure and providing their valuable suggestions. Finally, the author also thanks the Management and Maintenance team for ensuring availability of resources and functioning of the equipment. References [1]Gourav Vivek Kulkarni "Qualitative Effect of Solar Eclipse on Power Generation of Solar Power Plant" Published in International Journal of Trend in Scientific Research and Development (ijtsrd), ISSN: 24566470, Volume-4 | Issue-4, June 2020, pp.1238-1240 [2]https://www.accuweather.com/en/in/belgaum/18875 2/december-weather/188752?year=2019 [3]https://en.wikipedia.org/wiki/Solar_eclipse_of_Decem ber_26,_2019 [4]https://www.timeanddate.com/eclipse/in/india/belga um?iso=20191226 [5]Hicks, Charles Robert (1964). Fundamental Concepts in the Design of Experiments. New York: Holt, Rinehart and Winson. @ IJTSRD | Unique Paper ID – IJTSRD31541 | Volume – 4 | Issue – 4 | May-June 2020 Page 1388