Download
1 / 4
40 likes | 42 Views
Folk literature has always remained the veritable connection between the reader and the heritage of the land, orally transmitted from one generation to the other. With the advent of the colonisers from Europe came the colonial trappings of hegemonic, patriarchal structure which aimed at the socio economic aggrandizement of the colonising countries at the cost of the colonised ones. They disguised their administrative goals in the borrowed garbs of rationality and knowledge. The proposed paper would try to understand the intentions of the colonisers and analyse the resistance exhibited by the colonised narrators in the domain of folk literature in nineteenth century India. Arijit Goswami "Registering Resistance: Ambiguity of the Native Narratorial Voice and the Colonial Folklorist in Nineteenth Century India" Published in International Journal of Trend in Scientific Research and Development (ijtsrd), ISSN: 2456-6470, Volume-4 | Issue-5 , August 2020, URL: https://www.ijtsrd.com/papers/ijtsrd33070.pdf Paper Url :https://www.ijtsrd.com/humanities-and-the-arts/english/33070/registering-resistance-ambiguity-of-the-native-narratorial-voice-and-the-colonial-folklorist-in-nineteenth-century-india/arijit-goswami<br>

E N D
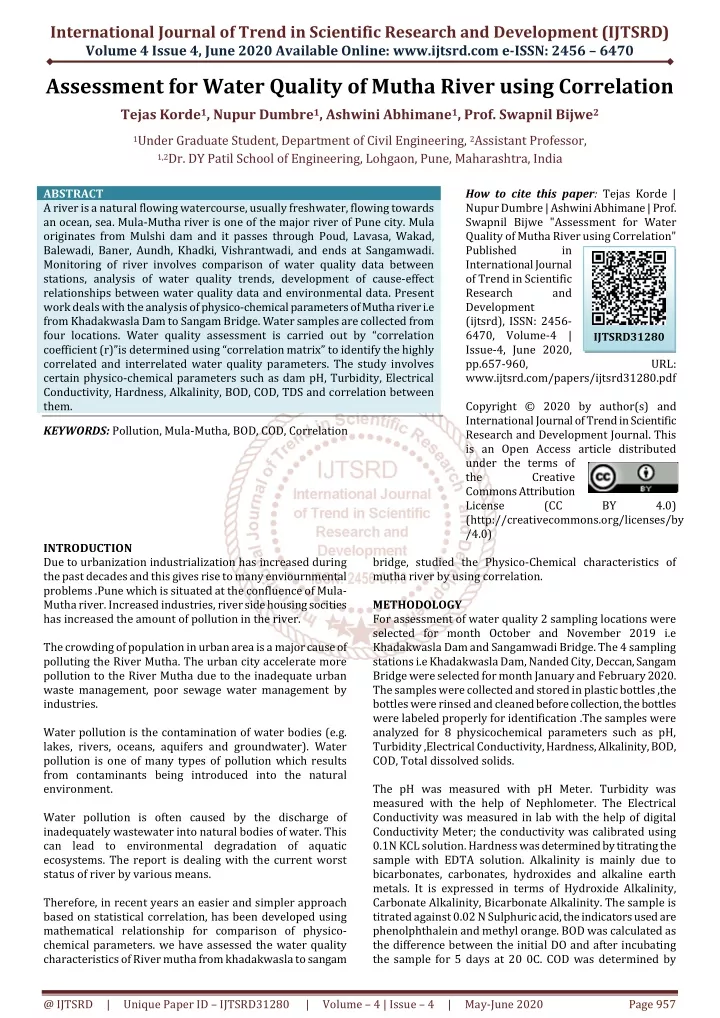
International Journal of Trend in Scientific Research and Development (IJTSRD) Volume 4 Issue 4, June 2020 Available Online: www.ijtsrd.com e-ISSN: 2456 – 6470 Assessment for Water Quality of Mutha River using Correlation Tejas Korde1, Nupur Dumbre1, Ashwini Abhimane1, Prof. Swapnil Bijwe2 1Under Graduate Student, Department of Civil Engineering, 2Assistant Professor, 1,2Dr. DY Patil School of Engineering, Lohgaon, Pune, Maharashtra, India ABSTRACT A river is a natural flowing watercourse, usually freshwater, flowing towards an ocean, sea. Mula-Mutha river is one of the major river of Pune city. Mula originates from Mulshi dam and it passes through Poud, Lavasa, Wakad, Balewadi, Baner, Aundh, Khadki, Vishrantwadi, and ends at Sangamwadi. Monitoring of river involves comparison of water quality data between stations, analysis of water quality trends, development of cause-effect relationships between water quality data and environmental data. Present work deals with the analysis of physico-chemical parameters of Mutha river i.e from Khadakwasla Dam to Sangam Bridge. Water samples are collected from four locations. Water quality assessment is carried out by “correlation coefficient (r)”is determined using “correlation matrix” to identify the highly correlated and interrelated water quality parameters. The study involves certain physico-chemical parameters such as dam pH, Turbidity, Electrical Conductivity, Hardness, Alkalinity, BOD, COD, TDS and correlation between them. KEYWORDS: Pollution, Mula-Mutha, BOD, COD, Correlation How to cite this paper: Tejas Korde | Nupur Dumbre | Ashwini Abhimane | Prof. Swapnil Bijwe "Assessment for Water Quality of Mutha River using Correlation" Published in International Journal of Trend in Scientific Research and Development (ijtsrd), ISSN: 2456- 6470, Volume-4 | Issue-4, June 2020, pp.657-960, www.ijtsrd.com/papers/ijtsrd31280.pdf Copyright © 2020 by author(s) and International Journal of Trend in Scientific Research and Development Journal. This is an Open Access article distributed under the terms of the Creative Commons Attribution License (CC (http://creativecommons.org/licenses/by /4.0) IJTSRD31280 URL: BY 4.0) INTRODUCTION Due to urbanization industrialization has increased during the past decades and this gives rise to many enviournmental problems .Pune which is situated at the confluence of Mula- Mutha river. Increased industries, river side housing socities has increased the amount of pollution in the river. The crowding of population in urban area is a major cause of polluting the River Mutha. The urban city accelerate more pollution to the River Mutha due to the inadequate urban waste management, poor sewage water management by industries. Water pollution is the contamination of water bodies (e.g. lakes, rivers, oceans, aquifers and groundwater). Water pollution is one of many types of pollution which results from contaminants being introduced into the natural environment. Water pollution is often caused by the discharge of inadequately wastewater into natural bodies of water. This can lead to environmental degradation of aquatic ecosystems. The report is dealing with the current worst status of river by various means. Therefore, in recent years an easier and simpler approach based on statistical correlation, has been developed using mathematical relationship for comparison of physico- chemical parameters. we have assessed the water quality characteristics of River mutha from khadakwasla to sangam bridge, studied the Physico-Chemical characteristics of mutha river by using correlation. METHODOLOGY For assessment of water quality 2 sampling locations were selected for month October and November 2019 i.e Khadakwasla Dam and Sangamwadi Bridge. The 4 sampling stations i.e Khadakwasla Dam, Nanded City, Deccan, Sangam Bridge were selected for month January and February 2020. The samples were collected and stored in plastic bottles ,the bottles were rinsed and cleaned before collection, the bottles were labeled properly for identification .The samples were analyzed for 8 physicochemical parameters such as pH, Turbidity ,Electrical Conductivity, Hardness, Alkalinity, BOD, COD, Total dissolved solids. The pH was measured with pH Meter. Turbidity was measured with the help of Nephlometer. The Electrical Conductivity was measured in lab with the help of digital Conductivity Meter; the conductivity was calibrated using 0.1N KCL solution. Hardness was determined by titrating the sample with EDTA solution. Alkalinity is mainly due to bicarbonates, carbonates, hydroxides and alkaline earth metals. It is expressed in terms of Hydroxide Alkalinity, Carbonate Alkalinity, Bicarbonate Alkalinity. The sample is titrated against 0.02 N Sulphuric acid, the indicators used are phenolphthalein and methyl orange. BOD was calculated as the difference between the initial DO and after incubating the sample for 5 days at 20 0C. COD was determined by @ IJTSRD | Unique Paper ID – IJTSRD31280 | Volume – 4 | Issue – 4 | May-June 2020 Page 957
International Journal of Trend in Scientific Research and Development (IJTSRD) @ www.ijtsrd.com eISSN: 2456-6470 titrating the samples with 0.1 N ferrous ammonium sulphate using ferrioc indicator. The correlation is found out in Microsoft Excel 2013, the correlation coefficient is found in the same. Comparing all the parameters with each other and finding the correlation matrix in excel. It became very easy for us to solve the matrix due to Excel.Correlation matix was found out for each sampling station. The correlation study is basially carried out to establish the relationship between the physico-chemical parameters. Fig3. DECCAN Fig1. KHADAKWASLA DAM Fig4. SANAGMWADI BRIDGE Fig2. NANDED CITY Fig.5 SATELLITE IMAGE OF SAMPLING STATIONS @ IJTSRD | Unique Paper ID – IJTSRD31280 | Volume – 4 | Issue – 4 | May-June 2020 Page 958
International Journal of Trend in Scientific Research and Development (IJTSRD) @ www.ijtsrd.com eISSN: 2456-6470 OBSERVATION: OBSERVATION AT STATION ONE: Khadakwasla Dam OCTOBER NOVEMBER 8.4 8.1 3 NTU 4.6 NTU 37μmho/cm 40μmho/cm 75 mg/L 69 mg/L 95ppm CaCo3 92ppm CaCo3 92ppm CaCo3 94ppm CaCo3 20.2 ppm 20 ppm 65 mg/L 63.5mg/L 80 mg/L 84 mg/L PARAMETERS pH Turbidity EC Hardness Alkalinity BOD COD TDS JANUARY 7.9 3.5 NTU 41 μmho/cm 78mg/L FEBRUARY 7.8 3 NTU 49 μmho/cm 81 mg/L PERMISSIBLE LIMIT 8.5 5 NTU 300 μmho/cm 300 mg/L 200ppm CaCo3 100 ppm 100 mg/L 500 mg/L 21.2 ppm 62 mg/L 85 mg/L 24 ppm 65 mg/L 92 mg/L CORRELATION MATRIX EC Hardness Alkalinity 1 0.9994 1 0.9989 0.9991 0.9999 0.9997 0.9970 0.9966 0.9999 0.9994 OBSERVATION AT STATION TWO: Nanded City PARAMETERS JANUARY pH 6.2 Turbidity 15 NTU EC 351 μmho/cm Hardness 175 mg/L Alkalinity 71 ppm CaCo3 BOD 225 ppm COD 390 mg/L TDS 418 mg/L pH 1 Turbidity 1 0.7026 0.6838 0.6954 0.6927 0.6828 0.7072 BOD 1 0.9971 0.9997 0.9970 COD 1 TDS 1 pH Turbidity EC Hardness Alkalinity 0.6691 BOD COD TDS 0.4733 0.6350 0.6409 1 0.6334 0.6769 0.6440 0.9989 0.9985 0.9993 FEBRUARY 6.5 18 NTU 362 μmho/cm 181 mg/L 72ppm CaCo3 226 ppm 405 mg/L 425 mg/L PERMISSIBLE LIMIT 8.5 5 NTU 300 μmho/cm 300 mg/L 200ppm CaCo3 100 ppm 100 mg/L 500 mg/L CORRELATION MATRIX EC Hardness Alkalinity 1 -0.9781 1 -0.9849 0.9994 0.9872 -0.9988 0.9924 -0.9963 -0.9704 0.9994 OBSERVATION AT STATION THREE: Deccan PARAMETERS JANUARY pH 6.9 Turbidity 3 NTU EC 164 μmho/cm Hardness 120 mg/L Alkalinity 89 ppm CaCo3 91 ppm CaCo3 BOD 22.1 ppm COD 71 mg/L TDS 158 mg/L pH 1 Turbidity 1 0.9985 -0.9652 -0.9739 0.9769 0.9841 -0.9556 BOD 1 0.9993 -0.9965 -0.9927 COD 1 TDS 1 pH Turbidity -0.9419 EC Hardness Alkalinity BOD COD TDS -0.9590 0.9970 0.9936 -0.9919 -0.9866 0.9991 1 -0.9999 -0.9987 0.9975 FEBRUARY 7.2 3.5 NTU 188 μmho/cm 132 mg/L PERMISSIBLE LIMIT 8.5 5 NTU 300 μmho/cm 300 mg/L 200 ppm CaCo3 100 ppm 100 mg/L 500 mg/L 26 ppm 68 mg/L 170 mg/L @ IJTSRD | Unique Paper ID – IJTSRD31280 | Volume – 4 | Issue – 4 | May-June 2020 Page 959
International Journal of Trend in Scientific Research and Development (IJTSRD) @ www.ijtsrd.com eISSN: 2456-6470 CORRELATION MATRIX EC Hardness Alkalinity 1 0.9943 1 0.9887 0.9990 0.9926 0.9999 0.9687 0.9896 0.9909 0.9996 OBSERVATION AT STATION FOUR: Sangamwadi Bridge OCTOBER NOVEMBER 6.9 6.5 16 NTU 19 NTU 190 μmho/cm 208 μmho/cm 150 mg/L 122 mg/L 75 ppm 70 ppm 220 ppm CaCo3 212 ppm CaCo3 221 ppm CaCo3 119 ppm CaCo3 405 mg/L 401 mg/L 346 mg/L 350 mg/L pH 1 Turbidity 1 0.9971 0.9833 0.9744 0.9804 0.9468 0.9777 BOD 1 0.9916 0.9999 0.9933 COD 1 TDS 1 pH Turbidity EC Hardness Alkalinity 0.9870 BOD COD TDS 0.9979 0.9999 0.9931 1 0.9912 0.9658 0.9893 0.9996 0.9949 0.9999 PARAMETERS pH Turbidity EC Hardness Alkalinity BOD COD TDS JANUARY 6.6 15.5NTU 220 μmho/cm 135 mg/L 73 ppm FEBRUARY 6.8 17 NTU 252 μmho/cm 150 mg/L 77 ppm PERMISSIBLE LIMIT 8.5 5 NTU 300 μmho/cm 300 mg/L 200 ppm 100 ppm CaCo3 100 mg/L 500 mg/L 389 mg/L 336 mg/L 392 mg/L 332 mg/L CORRELATION MATRIX EC Hardness Alkalinity 1 0.8598 1 0.8632 0.9931 -0.9233 -0.7420 -0.8713 -0.9859 0.8042 0.9734 [2]Pali Sahu, Sonali Karad, Sagar Chavan and Sourabh Khandelwal (2015): PHYSICOCHEMICAL ANALYSIS OF MULA MUTHA RIVER PUNE. [3]V. M. Wagh, V. S. Ghole, P. N. Wavde, V.V. Todkar and K. K. Kokate (2008): Assessment of water quality of mutha river in pune city. [4]S. D. Jadhav (2017)-Analysis of water quality using physico-chemical parameters of mula-mutha river. [5]Pravin A. Manatkar, Anuj S. Chordia, Roche H. Harry, Sanket S. Sharma, Rajkumar I. Kothari, Akshay A. Arote(2018)-Physico-chemical analysis and curative approach to mutha river pollution. [6]Madhulekha, Sunita Arya, Shashi Agarwal (2017) - Study of Correlation Coefficient for Physico-Chemical Parameter to Assess the Water Quality of River Ganga at Kanpur, India. [7]Qureshimatva Umerfaruq M, Maurya Rupesh R, Gamit Sandip B and Solanki Hitesh A (2015) - Studies on the Physico-Chemical Coefficient of Sarkhej Roza Lake, District Ahmedabad, Gujarat, India. [8]NARENDRA SINGH BHANDARI and KAPIL NAYAL (2008) - Correlation Study on Physico-Chemical Parameters and Quality Assessment of Kosi River Water, Uttarakhand. [9]Introduction to Environmental Engineering and Science” by Gilbert M Masters. [10]IS 10500 2004. [11]IS 3052 (Part 32) for water and waste water. pH 1 Turbidity 1 -0.8218 -0.9814 -0.9747 0.6515 0.9725 -0.9515 BOD 1 0.7093 -0.6440 -0.9894 COD 1 TDS 1 pH Turbidity -0.9764 EC Hardness Alkalinity BOD COD TDS 0.8339 0.9982 0.9878 -0.7272 -0.9776 0.9710 1 -0.7178 -0.9983 0.9905 CONCLUSION: From the investigation it is concluded that in the month of October and November the samples from Khadakwasla Dam were within the permissible limits as given in IS 10500 2012. But at Sanagm Bridge Turbidity ,BOD,COD was not in the permissible limits as per the IS Code.The next samples taken in the month of January and February from 4 stations i.e Khadakwasla Dam, Nanded City, Deccan, Sangam Bridge. It is observed that the observations from the sample from Nanded City is more polluted than the sample taken from other sampling stations. Due to Housing Societies more discharge of waste water is observed and due to this the amount of pollutants has increased at the particular location. At the other sampling locations the results were within the permissible limits as given in the IS code. The values differ due to increase in pollution at sangam bridge and Nanded city. As the above correlation matrix gives the value of correlation coefficient .The correlation matrix shows the correlation between the water physico-chemical parameters of water. Every matrix shows the correlation between each parameter which lies in between -1 & 1. The quality of water is seriously affected by the pollutants in the area Nanded City and Sangamwadi Bridge .The correlation matrix indicates positive and negative with each other. REFERENCES: [1]A. Achegave, P. Bade, S. Rahate (2017): Water Quality Monitoring of Mula-Mutha River In Pune Region, Maharashtra, India. Parameters and Correlation @ IJTSRD | Unique Paper ID – IJTSRD31280 | Volume – 4 | Issue – 4 | May-June 2020 Page 960