Download
1 / 10
100 likes | 114 Views
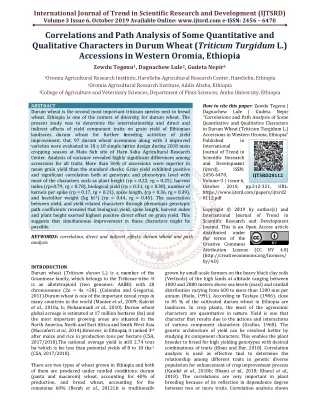
Durum wheat is the second most important triticum species next to bread wheat. Ethiopia is one of the centers of diversity for durum wheat. The present study was to determine the interrelationship and direct and indirect effects of yield component traits on grain yield of Ethiopian landraces durum wheat for further breeding activities of yield improvement. Out, 97 durum wheat accessions along with 3 improved varieties were evaluated in 10 x 10 simple lattice design during 2018 main cropping season at Mata Sub site of Haro Sabu Agricultural Research Center. Analysis of variance revealed highly significant differences among accessions for all traits. More than 36 of accessions were superior in mean grain yield than the standard checks. Grain yield exhibited positive and significant correlation both at genotypic and phenotypic level with most of the characters such as plant height rp = 0.22, rg = 0.25 , harvest index rp=0.79, rg = 0.78 , biological yield rp = 0.31, rg = 0.30 , number of kernels per spike rp = 0.17, rg = 0.21 , spike length, rp = 0.36, rg = 0.39 , and hectoliter weight kg hl 1 rp = 0.44, rg = 0.45 . The association between yield, and yield related characters through phenotypic genotypic path coefficients revealed that biological yield, spike length, harvest index and plant height exerted highest positive direct effect on grain yield. This suggests that simultaneous improvement in these characters might be possible Zewdu Tegenu | Dagnachew Lule | Gudeta Nepir "Correlations and Path Analysis of Some Quantitative and Qualitative Characters in Durum Wheat (Triticum Turgidum L.) Accessions in Western Oromia, Ethiopia" Published in International Journal of Trend in Scientific Research and Development (ijtsrd), ISSN: 2456-6470, Volume-3 | Issue-6 , October 2019, URL: https://www.ijtsrd.com/papers/ijtsrd28112.pdf Paper URL: https://www.ijtsrd.com/engineering/agricultural-engineering/28112/correlations-and-path-analysis-of-some-quantitative-and-qualitative-characters-in-durum-wheat-triticum-turgidum-l-accessions-in-western-oromia-ethiopia/zewdu-tegenu<br>

E N D
International Journal of Trend in Scientific Research and Development (IJTSRD) International Journal of Trend in Scientific Research and Development (IJTSRD) International Journal of Trend in Scientific Research and Development (IJTSRD) Volume 3 Issue 6, October 2019 2019 Available Online: www.ijtsrd.com e-ISSN: 2456 ISSN: 2456 – 6470 Correlations and Path Analysis Qualitative Characters i Accessions i Zewdu Tegenu Zewdu Tegenu1, Dagnachew Lule2, Gudeta Nepir3 nd Path Analysis of Some Quantitative in Durum Wheat (Triticum Turgidum in Western Oromia, Ethiopia n Western Oromia, Ethiopia f Some Quantitative and Triticum Turgidum L.) 1Oromia Agricultural Research Institute, HaroSebu Agricultural Research Center 2Oromia Agricultural Research Institute 3College of Agriculture and Veterinary Sciences, Department of Plant Sciences, Ambo University, Ethiopia College of Agriculture and Veterinary Sciences, Department of Plant Sciences, Ambo University, Ethiopia College of Agriculture and Veterinary Sciences, Department of Plant Sciences, Ambo University, Ethiopia Oromia Agricultural Research Institute, HaroSebu Agricultural Research Center, HaroSebu, Oromia Agricultural Research Institute, Addis Ababa, Ethiopia HaroSebu, Ethiopia ABSTRACT Durum wheat is the second most important triticum wheat. Ethiopia is one of the centers of diversity for durum wheat. The present study was to determine the interrelationship and direct and indirect effects of yield component traits on grain yield of Ethiopian landraces durum wheat for further breeding activities of yield improvement. Out, 97 durum wheat accessions along with 3 improved varieties were evaluated in 10 x 10 simple lattice design during 2018 main cropping season at Mata Sub site of Haro Sabu Agricultural Research Center. Analysis of variance revealed highly significant differences among accessions for all traits. More than 36% of accessions were superior in mean grain yield than the standard checks. Grain yield exhibited positive and significant correlation both at genotypic and phenotypic level with most of the characters such as plant height (rp = 0.22, rg = 0.25), harvest index (rp=0.79, rg = 0.78), biological yield (rp = 0.31, rg = 0.30), number of kernels per spike (rp = 0.17, rg = 0.21), spike length, (rp = 0.36, rg and hectoliter weight (kg hl-1) (rp = 0.44, rg = 0.45). The association between yield, and yield related characters through phenotypic genotypic path coefficients revealed that biological yield, spike length, harvest index and plant height exerted highest positive direct effect on grain yield. This suggests that simultaneous improvement in these characters might be possible. KEYWORDS: correlation, direct and indirect effects, durum wheat and path analysis How to cite this Dagnachew "Correlations and Path Analysis of Some Quantitative and Qualitative Characters in Durum Wheat (Triticum Turgidum L.) Accessions in Western Oromia, Ethiopia" Published in International Journal of Trend i Scientific Research and Development (ijtsrd), ISSN: 2456-6470, Volume-3 | Issue October 2019, pp.312 https://www.ijtsrd.com/papers/ijtsrd2 8112.pdf Copyright © 2019 by author(s) and International Journal of Trend in Scientific Research and Journal. This is an Open Access article distributed under the terms of the Creative Commons Attribution License (http://creativecommons.org/licenses/ by/4.0) paper: Zewdu Tegenu | Durum wheat is the second most important triticum species next to bread wheat. Ethiopia is one of the centers of diversity for durum wheat. The present study was to determine the interrelationship and direct and indirect effects of yield component traits on grain yield of Ethiopian for further breeding activities of yield improvement. Out, 97 durum wheat accessions along with 3 improved varieties were evaluated in 10 x 10 simple lattice design during 2018 main cropping season at Mata Sub site of Haro Sabu Agricultural Research . Analysis of variance revealed highly significant differences among accessions for all traits. More than 36% of accessions were superior in mean grain yield than the standard checks. Grain yield exhibited positive Dagnachew "Correlations and Path Analysis of Some Quantitative and Qualitative Characters in Durum Wheat (Triticum Turgidum L.) Accessions in Western Oromia, Ethiopia" Published in Lule Lule | | Gudeta Gudeta Nepir Nepir Journal of Trend in Scientific Research and Development (ijtsrd), ISSN: ypic and phenotypic level with plant height (rp = 0.22, rg = 0.25), harvest IJTSRD28112 3 | Issue-6, 2019, index (rp=0.79, rg = 0.78), biological yield (rp = 0.31, rg = 0.30), number of kernels per spike (rp = 0.17, rg = 0.21), spike length, (rp = 0.36, rg = 0.39), ) (rp = 0.44, rg = 0.45). The association between yield, and yield related characters through phenotypic genotypic path coefficients revealed that biological yield, spike length, harvest index d highest positive direct effect on grain yield. This suggests that simultaneous improvement in these characters might be October https://www.ijtsrd.com/papers/ijtsrd2 pp.312-321, URL: Copyright © 2019 by author(s) and International Journal of Trend in Scientific Research and Development Journal. This is an Open Access article distributed under the terms of the Creative Commons Attribution License http://creativecommons.org/licenses/ correlation, direct and indirect effects, durum wheat and path (CC (CC BY BY 4.0) 4.0) INTRODUCTION Durum wheat (Triticum durum L.) is a member of the Gramineae family, which belongs to the Triticeae tribe. It is an allotetraploid (two genomes: AABB) with 28 chromosomes (2n = 4x =28). (Colomba and Gregorini, 2011).Durum wheat is one of the important cereal crops in many countries in the world (Maniee et al., 2009; Kahrizi et al., 2010a, b; Mohammadi et al., 2010). Durum wheat global acreage is estimated at 17 million hectares (ha) and the most important growing areas are situated in the North America, North and East Africa and South West Asia (Maccaferri et al., 2014).However, in Ethiopia, it ranked 3 after maize and rice in production tons per hectare (CSA, 2017/2018).The national average yield is still 2.74 tons ha-1which is far less than potential yields of 8 to 10 tha (CSA, 2017/2018). There are two types of wheat grown in Ethiopia and both of them are produced under rainfed conditions: durum (pasta and macaroni) wheat, accounting for 40% of production, and bread wheat, accounting for the remaining 60% (Bergh et al., 2012).It is traditionally grown by small-scale farmers on the heavy black clay soils (Vertisols) of the high lands at altitude ranging between 1800 and 2800 meters above sea levels (masl) and rainfall distribution varying from 600 to more than 1200 mm per annum (Hailu, 1991). According to Tesfaye (1986), close to 85 % of the cultivated durum wheat in Ethiopia are landraces. In crop plants, the most of the agronomic characters are quantitative in nature. Yield is one that character that results due to the a of various component characters (Grafius, 1960). The genetic architecture of yield can be resolved better by studying its component characters. This enables the plant breeder to breed for high yielding genotypes with desired combinations of traits (Khan and Dar, 2010). Correlation analysis is used as effective tool to determine the relationship among different traits in genetic diverse population for enhancement of crop improvement process (Kandel et al., 2018b; Dhami et al 2018). The correlations are very important in plant breeding because of its reflection in dependence degree between two or more traits. Correlation analysis shows between two or more traits. Correlation analysis shows L.) is a member of the scale farmers on the heavy black clay soils (Vertisols) of the high lands at altitude ranging between 1800 and 2800 meters above sea levels (masl) and rainfall distribution varying from 600 to more than 1200 mm per annum (Hailu, 1991). According to Tesfaye (1986), close to 85 % of the cultivated durum wheat in Ethiopia are landraces. In crop plants, the most of the agronomic characters are quantitative in nature. Yield is one that character that results due to the actions and interactions of various component characters (Grafius, 1960). The genetic architecture of yield can be resolved better by studying its component characters. This enables the plant breeder to breed for high yielding genotypes with desired tions of traits (Khan and Dar, 2010). Correlation analysis is used as effective tool to determine the relationship among different traits in genetic diverse population for enhancement of crop improvement process Gramineae family, which belongs to the Triticeae tribe. It is an allotetraploid (two genomes: AABB) with 28 chromosomes (2n = 4x =28). (Colomba and Gregorini, Durum wheat is one of the important cereal crops in ., 2009; Kahrizi ., 2010). Durum wheat global acreage is estimated at 17 million hectares (ha) and the most important growing areas are situated in the South West Asia ., 2014).However, in Ethiopia, it ranked 3rd after maize and rice in production tons per hectare (CSA, 2017/2018).The national average yield is still 2.74 tons which is far less than potential yields of 8 to 10 tha-1 There are two types of wheat grown in Ethiopia and both of them are produced under rainfed conditions: durum (pasta and macaroni) wheat, accounting for 40% of production, and bread wheat, accounting for the et al., 2018; Kharel et al., 2018). The correlations are very important in plant breeding because of its reflection in dependence degree 12).It is traditionally
International Journal of Trend in Scientific Research and Development (IJTSRD) @ www.ijtsrd.com eISSN: 2456-6470 the intensity of dependence (correlation) between studied traits. In wheat, many breeders try to explain the relations between grain yield and agronomic and morphological traits by using simple correlation coefficients. Path analysis provides a measure of relative importance of each independent variable to prediction of changes in the dependent one. A path coefficient is a standardized partial regression coefficient and as such measures the direct effect of one trait upon other and permits the separation of correlation coefficient into direct and indirect effects (Dewey and Lu, 1959; Phougat et al., 2017). Path coefficients show direct influence of independent variable upon dependent variable (Lidansky, 1988). In agriculture, path coefficient analysis has been used by MATERIALS AND METHODS Study Area The experiment was conducted during the main cropping season of 2018 at Mata research sub-site of Haro-Sabu Agricultural Research Center (HSARC), Sayo district of Kellem Wollega Zone. Mata research sub-site is located at 652km West of Addis Ababa.It is located between 8o10’00’’N to 8o50’00’’N and 34o39’30’’E to 34o59’30’’E (Figure 1) with an elevation of 2025 meters above sea level. plant breeders to assist in identifying traits that are useful as selection criteria to improve crop yield (Dewey and Lu, 1959; Milligan et al., 1990; Ahmed et al., 2003; Bhujel et al., 2018; Kandel et al., 2018a). Quantitative characters like as grain yield is a complex character influenced directly or indirectly by several genes present in the plant (Bhutta et al., 2005) that making difficult for direct selection. In most breeding programs, the strategy is based on simultaneous selection for several traits and therefore the knowledge on the genetic association between traits is very useful for the establishment of selection criteria. The objective of this study was to establish the interrelationship and direct and indirect effects of some yield components among themselves and with grain yield in durum wheat accessions. Figure1: Map of the study area. Soil types of the study area classified as 90% loam, 6% sand and 4% clay soil type. Mean annual rainfall of the area is 1219.15 mm and the minimum and maximum annual temperatures are16.21and 27.77°C, respectively with the relative humidity of 67.5% Source: (Sayo district Agriculturen and Natural Resource office, Dembi Dollo, unpublished) Breeding materials and experimental design Materials of this study consisted of 100 genotypes of durum wheat, of which 97 landraces (accessions) and three released varieties as standard checks (Bekalcha, Dire and Obsa) obtained from Sinana Agricultural Research Center were used for this study provided by Ethiopia Biodiversity Institute (EBI) (Table 1) Materials were sown in the first week of August 2018 in Mata sub site in 10 x 10 simple lattice design with two replications. Seed was drilled on 20 cm rowspacing, 1m row length and 1 m spacing between each block.Seed rate of 150 kg ha-1 and.combination of UREA and NPS fertilizers were applied at the recommendation rate of 100 kg ha-1. UREA was applied in split form (half at planting and the rest half was applied at tiller initiation 35 days after emergence. Other crop management practices were undertaken as per the recommendation
International Journal of Trend in Scientific Research and Development (IJTSRD) @ www.ijtsrd.com eISSN: 2456-6470 Table1: List of durum wheat accessions collected from different regions of Ethiopia. Entry code Acc. No Genus name species name Region 1 7375 Triticum dicoccum 2 5582 Triticum dicoccum 3 7710 Triticum dicoccum 4 238891 Triticum dicoccum 5 7207 Triticum dicoccum 6 5181 Triticum dicoccum 7 242782 Triticum sp 8 242793 Triticum sp 9 7532 Triticum sp 10 7056 Triticum sp 11 7880 Triticum sp 12 242781 Triticum sp 13 5182 Triticum sp 14 5171 Triticum sp 15 222393 Triticum sp 16 7649 Triticum sp 17 5216 Triticum sp 18 5020 Triticum sp 19 6102 Triticum sp 20 242790 Triticum sp 21 5184 Triticum sp 22 5515 Triticum sp 23 5528 Triticum sp 24 7084 Triticum sp 25 7683 Triticum sp 26 242785 Triticum sp 27 7343 Triticum sp 28 7832 Triticum sp 29 6983 Triticum sp 30 5472 Triticum sp 31 5354 Triticum sp 32 5729 Triticum sp 33 7647 Triticum sp 34 6988 Triticum sp 35 5583 Triticum sp 36 7020 Triticum sp 37 239694 Triticum sp 38 5183 Triticum sp 39 5556 Triticum sp 40 5175 Triticum sp 41 5373 Triticum sp 42 6968 Triticum sp 43 7664 Triticum sp 44 7218 Triticum sp 45 5043 Triticum sp 46 6978 Triticum sp 47 7009 Triticum sp 48 5174 Triticum sp 49 7709 Triticum sp 50 230678 Triticum sp Latitude Longitude Altitude 1710 2280 1980 2200 1990 1900 2400 2460 2460 2350 2030 2140 2040 2390 2400 2460 2150 2040 2440 2395 2400 2430 2460 2440 2430 2410 2460 2300 2430 2410 2310 1790 2470 2260 2300 2330 2300 2300 2200 2133 2300 2160 2300 2330 2260 2260 2333 2300 2450 2300 Oromia 07-07-00-N 40-43-00-E Oromia 08-57-00-N 37-52-00-E Oromia 07-08-00-N 40-43-00-E Oromia 07-01-30-N 40-21-07-E Oromia 07-01-40-N 40-23-55-E Oromia 07-01-20-N 40-19-46-E Amara 11-05-00-N 37-52-00-E Amara 10-18-00-N 38-12-00-E Amara 10-18-00-N 38-12-00-E Oromia 09-00-00-N 38-07-00-E Oromia 07-17-00-N 38-36-00-E Oromia 07-44-00-N 39-34-00-E Oromia 08-24-00-N 39-52-00-E Amara 10-34-00-N 38-14-00-E Oromia 08-49-00-N 38-54-00-E Amara 10-26-00-N 38-20-00-E Oromia 08-12-00-N 39-34-00-E Oromia 08-24-00-N 39-52-00-E Oromia 07-46-00-N 39-47-00-E Oromia 07-41-00-N 40-13-00-E Oromia 07-45-00-N 39-40-00-E Oromia 07-44-00-N 39-53-00-E Amara 10-18-00-N 38-12-00-E Amara 10-14-00-N 38-01-00-E Oromia 07-39-00-N 39-46-00-E Oromia 07-50-00-N 39-38-00-E Amara 10-18-00-N 38-12-00-E Amara 11-21-00-N 39-18-00-E Amara 10-28-00-N 38-17-00-E Amara 10-28-00-N 38-18-00-E Oromia 08-53-00-N 37-51-00-E Amara 11-06-00-N 39-45-00-E Amara 11-05-00-N 37-42-00-E Oromia 09-14-00-N 41-09-00-E Oromia 08-54-00-N 38-54-00-E Oromia 09-00-00-N 39-07-00-E Oromia 38-54-00-N 38-54-00-E Oromia 08-47-00-N 39-15-00-E Oromia 09-47-00-N 39-16-00-E Oromia 08-52-00-N 39-01-00-E Oromia 38-54-00-N 38-54-00-E Oromia 09-24-00-N 38-47-00-E Oromia 09-01-00-N 39-15-00-E Oromia 09-00-00-N 39-07-00-E Amara 08-50-00-N 39-19-00-E Amara 08-50-00-N 39-19-00-E Oromia 08-51-00-N 38-30-00-E Oromia 08-59-00-N 38-52-00-E Oromia 09-01-00-N 39-03-00-E Oromia 08-51-00-N 38-52-00-E Entry code 51 52 53 54 55 56 57 58 Acc. No 242789 242792 5214 5428 7801 242791 5491 5510 Genus name Triticum Triticum Triticum Triticum Triticum Triticum Triticum Triticum species name sp sp sp sp sp sp sp sp Region Latitude Longitude Altitude Oromia Oromia Oromia Oromia Oromia Oromia Oromia Oromia 08-54-00-N 08-59-00-N 08-58-00-N 08-47-00-N 09-01-00-N 09-01-00-N 08-59-00-N 08-54-00-N 39-01-00-E 38-52-00-E 39-00-00-E 39-15-00-E 39-15-00-E 39-15-00-E 38-52-00-E 39-05-00-E 2350 2300 2420 2300 2300 2300 2300 2200 @ IJTSRD | Unique Paper ID – IJTSRD28112 | Volume – 3 | Issue – 6 | September - October 2019 Page 314
International Journal of Trend in Scientific Research and Development (IJTSRD) @ www.ijtsrd.com eISSN: 2456-6470 59 60 61 62 63 64 65 66 67 68 69 70 71 72 73 74 75 76 77 78 79 80 81 82 83 84 85 86 87 88 89 90 91 92 93 94 95 96 97 98 99 100 7015 242784 5635 5609 5666 5572 5504 5197 7827 242786 5653 5534 242783 226897 5168 5179 7825 5198 8072 242779 5492 243733 5638 242780 5597 5044 5152 5554 7018 5669 7828 5367 5344 5434 5166 5149 5169 5441 5557 Bekalcha Dire obsa Triticum Triticum Triticum Triticum Triticum Triticum Triticum Triticum Triticum Triticum Triticum Triticum Triticum Triticum Triticum Triticum Triticum Triticum Triticum Triticum Triticum Triticum Triticum Triticum Triticum Triticum Triticum Triticum Triticum Triticum Triticum Triticum Triticum Triticum Triticum Triticum Triticum Triticum Triticum Triticum Triticum Triticum Source: Ethiopian Biodiversity Institute (EBI) and Sinana ARC sp sp sp sp sp sp sp sp sp sp sp sp sp sp sp sp sp sp sp sp sp sp sp sp sp sp sp sp sp sp sp sp sp sp sp sp sp Oromia Oromia Tigray Oromia Tigray Oromia Oromia Oromia Oromia Oromia Oromia Oromia Oromia Oromia Oromia Oromia Oromia Amara Amara Amara Amara SNNP Oromia Amara Amara Oromia Oromia Amara Amara Oromia Oromia Oromia Amara Oromia Oromia Oromia Oromia Oromia Oromia Sinana ARC Sinana ARC Sinana ARC 08-49-00-N 08-45-00-N 14-10-00-N 08-48-00-N 14-07-00-N 08-45-00-N 08-45-00-N 08-45-00-N 08-47-00-N 08-45-00-N 08-45-00-N 08-45-00-N 09-47-00-N 09-47-00-N 09-47-00-N 09-47-00-N 09-47-00-N 08-50-00-N 08-50-00-N 08-50-00-N 08-50-00-N 09-29-00-N 08-51-00-N 08-50-00-N 12-38-00-N 09-47-00-N 08-47-00-N 10-34-00-N 11-00-00-N 07-12-00-N 08-50-00-N 08-54-00-N 12-19-00-N 08-47-00-N 08-51-00-N 08-16-00-N 08-59-00-N 07-47-00-N 08-58-00-N 39-00-00-E 39-08-00-E 38-42-00-E 38-54-00-E 38-29-00-E 39-13-00-E 39-15-00-E 39-13-00-E 39-15-00-E 39-15-00-E 39-08-00-E 39-15-00-E 39-46-00-E 39-46-00-E 39-16-00-E 39-16-00-E 39-16-00-E 39-19-00-E 39-19-00-E 39-19-00-E 39-19-00-E 38-30-00-E 38-30-00-E 39-19-00-E 37-28-00-E 39-46-00-E 39-46-00-E 37-29-00-E 36-54-00-E 38-35-00-E 38-22-00-E 39-01-00-E 37-33-00-E 39-15-00-E 38-30-00-E 38-52-00-E 38-52-00-E 39-39-00-E 37-36-00-E 1915 2350 2367 2080 2487 2070 2120 2160 2300 2120 2340 2120 2300 2300 2200 2300 2300 2260 2260 2260 2260 2333 2330 2260 2100 2300 2300 2145 2489 1773 1773 2350 2145 2300 2333 1791 2300 2415 2430 turgidum polonicum Improved variety Improved variety Improved variety Method of data collection Ten plants were selected randomly before heading from eachrow and tagged with thread and all the necessary plant based (measurable quantitative traits) average data were collected from these ten sampled plants. Plant-based data:- number of kernels per spike, plant height, spike length, spike weight per plant and number of spikelets per spike Plot based data:- days to heading, days to maturity, days to grain filling period, = thousand seed weight, grain yield, biological yield and harvest index Statistical analysis ANOVA of the tested genotypes was conducted for the simple lattice for the quantitative and qualitative data. Associations between all possible pairs of quantitative traits were evaluated for their significance using SAS software version 9.2 (SAS, 2008). Phenotypic and genotypic correlations between yield and yield related traits were estimated using the method described by Miller et al. (1958) and Kashiani and Saleh (2010) from the corresponding variance and covariance components as follows: Phenotypic correlation coefficient: pcov x.y rpxy = ?δ?px ∗ δ?py Genotypic correlation coefficient: gcov x.y rgxy = ?δ?gx ∗ δ?gy @ IJTSRD | Unique Paper ID – IJTSRD28112 | Volume – 3 | Issue – 6 | September - October 2019 Page 315
International Journal of Trend in Scientific Research and Development (IJTSRD) @ www.ijtsrd.com eISSN: 2456-6470 Where, rpxy= Phenotypic correlation coefficient between characters X and Y, rgxy= genotypic correlation coefficients between characters X and Y, pcovx.y and gcovx.y are phenotypic and genotypic covariance between variables x and y, respectively, 2p =Phenotypic Variance between characters X and Y, 2g =Genotypic Variance between characters X and Y. The calculated phenotypic correlation value was tested for its significance using t-test according to Sharma (1998): r t Where, rp = Phenotypic correlation; SE (rp) = Standard error of phenotypic correlation obtained using in the following procedure (Sharma, 1998). ) 1 ( n Where, n is the number of genotypes tested, and rp is phenotypic correlation coefficient. The coefficients of correlations at genotypic levels were tested for their significance using the formula described by Robertson (1959) as indicated below: r t Σrikpkj = summation of components of indirect effects of a given independent character (i) on a given dependent character (j) via all other independent characters (k). The residual factor (PR), was calculated as: PR= ?(1 − ∑??????) Where, i=any trait in the model, j=dependent variable (grain yield) and r=correlation coefficient between any trait i and the dependent variable j. Residual (R) is the square root of non-determination; the magnitude of PR indicates how best the causal factors account for the variability of the dependent Chaudhary,1999). RESULTS AND DISCUSSION Analysis of variance The analysis of variance revealed that there were highly significant differences (p<0.01) among the accessions with respect to grain yield, yield related traits and quality parameters (Table 2). Significant differences were recorded for parameters like Days to heading, days to maturity, grain filling period, plant height, biological yield, grain yield, harvest index, spike weight, thousand kernel weight (TKW), number of kernels per spike, number of spikelets per spike, spike length, gluten (%), moisture (%), protein (%), hectoliter weight and Water absorption (%) exhibited highly significant difference (p<0.01) among accessions. The result of relative efficiency of the design revealed that, for most characters’ more than 71%, simple lattice design was more efficient than randomized complete block design (Table 2). However, for traits like biological yield tons per hectare, percent gluten, percent moisture and hectoliter weight (kg hl-1), the error variance of the blocks within replications were smaller than to the intra block error. The significant differences of the parameters indicated that, there is considerable amount of genetic variation among the studied landraces (Table 2). This variation would offer scope of selection for development of desirable genotypes which, could also be attributed to the diverse composition of the populations evolved through time.Several researchers reported significant differences among bread and durum wheat genotypes studied (Kifle et al., 2016; Kumar et al., 2016; Wolde et al., 2016; Birhanu et al., 2016). Similarly, significant differences were reported for major traits in bread wheat (Kalimullah et al., 2012; Shashikala, 2006; Naik et al., 2015; Rahman et al., 2016) p SE ( r ) p factor (Singh and 2 r p SE (rp) = ( 2 ) gxy SEr gxy The calculated "t" value was compared with the tabulated "t" value at (n-2) degree of freedom at 5% and 1% level of significance.Where, n = number of genotypes: r SEr gxy . 2 Where, H2x = Heritability of trait x and H2 y = Heritability of trait y. Path coefficient analysis Path coefficient analysis was computed by Dewey and Lu (1959) using the phenotypic and genotypic correlation coefficients as:rij = Pij + Σrik * Pkj Where, rij = mutual association between the independent character i (yield- related trait) and dependent character, j (grain yield) as measured by the genotypic correlation coefficients; Pij = components of direct effects of the independent character (i) on the dependent character (j) as measured by the path coefficients; and 2 1 gxy Hx Hy Table2: Mean squares, degrees of freedom and some of statistical parameters of all studied traits of durum wheat landraces evaluated in 2018 season using simple lattice design. for 20 traits in 100 Accessions Blocks within Replicat ions DF=99 DF=1 DF=18 DF=81 DH 18.41** 1.28 0.99 0.85 68.77 DM 33.58** 0.05 0.77 1.14 103.57 GFP 52.75** 1.81 1.78 1.55 34.8 PH 366.00** 9.25 58.76 58.76 87.54 BY 9.29** 1.83** 0.02 0.03 8.6 GY 1.10** 0.02 0.05 0.04 1.57 IntraBlo ck Error Treat ments Repli cations Grand Mean Mean± SE LSD 5% R2 (%) Traits CV% Eff 1.34 1.03 3.83 8.76 1.88 11.93 68.77(±)0.92 103.57(±)1.07 34.80(±)1.33 87.54(±)7.67 8.60(±)0.16 1.57(±)0.19 1.86 2.06 2.61 15.21 0.32 0.38 100.38 94.12 108.69 100 96.61 101.69 97 97 97 90 100 97 @ IJTSRD | Unique Paper ID – IJTSRD28112 | Volume – 3 | Issue – 6 | September - October 2019 Page 316
International Journal of Trend in Scientific Research and Development (IJTSRD) @ www.ijtsrd.com eISSN: 2456-6470 HI SWT TKW NKPS NSPS SL GLT MTR PRT HLW WAB 147.33** 0.44** 206.23** 102.31** 40.51** 9.39** 16.77** 0.30** 7.95** 76.80** 25.99** 1.78 4.81** 18.91* 2461.91** 2119.01** 109.52** 33.29** 17.36** 11.43** 9.54** 42.30** 6.45 0.01 6.95* 0.02 0.81 0.22 0.49 0.04 0.04 0.05 0.26 5.37 0.01 3.87 0.02 0.51 0.21 0.6 0.07 0.03 0.03 0.38 18.88 1.39 32.43 42.61 30.4 7.61 31.72 10.56 16.61 69.43 16.38 12.27 7.25 6.07 0.29 2.36 5.99 2.44 2.49 1.04 0.23 3.74 18.88(±)2.32 1.39(±)0.10 32.43(±)1.97 42.61(±)0.12 30.40(±)0.72 7.61(±)1.46 31.72 (±)0.77 10.56 (±)0.26 16.61(±)0.17 69.42(±)0.16 16.38 (±) 0.61 4.68 0.20 4.18 0.25 1.50 0.91 1.53 0.52 0.34 0.32 1.22 100.6 101.14 105.92 101.29 103.63 100.04 96.67 92.26 100.52 105.44 94.29 97 98 99 100 99 99 97.6 90.2 99.7 100 99 Key: *and ** indicates significance at 0.05 and 0.01 probability levels, respectively. CV (%) = coefficient of variation, DF= degree of freedom Eff. = efficiency of lattice design relative to randomized complete block design and R2= r- square, SE= standard error; LSD=least significant difference, BY= biological yield tons ha-,1 DH= days to heading, DM= days to maturity, GLT= gluten (%), GFP = grain filling period, GY = grain yield tons ha-,1,HI = harvest index (%), HLW= hectoliter weight (kg hl-1), MTR= moisture (%),NKPS= number of kernels per spike, NSPS=number of spikelets per spike,PH = plant height(cm), PRT= protein (%),SL= spike length(cm), SW = spike weight(g), , TKW = thousand kernels weight(g), and WAB=water obsorption (%) Genotypic and phenotypic correlation of grain yield with other traits In the present study, the predictable values of phenotypic and genotypic correlation coefficients between all pairs of characters are presented in (Table 3). The analyses showed, genotypic correlation coefficient values were greater for most of the characters than their corresponding phenotypic correlation coefficient values, indicating inherent association of the characters so, that selection for the correlated characters could give a better yield. Phenotypic correlations Grain yield per plant showed positive and high significant (p<0.01) correlation with spike length (rp = 0.359), hectoliter weight (rp = 0.443), biological yield (rp = 0.297), and harvest index (rp = 0.790) (Table 3).It appears that phenotypic selection of phenotypically high values of these characters’ result in increasing yield potential. The studies made by Kifle et al. (2016), Kole (2006) and Anwar et al. (2009) showed that grain yield per plant had positive and significant correlations with spike length, biological yield, harvest index, number of kernels per spike and plant height both at genotypic and phenotypic levels. At phenotypic level, grain yield per plant was positively and significantly associated with biological yield and harvest index (Amardeep et al., 2017). Moreover, grain yield showed negative and high significant phenotypic correlation with percent of protein (rp = -0.548) (Table 3) Similarly, Blanco et al. (2010) reported negative and significant correlation between days to heading and lodging. Genotypic correlations Grain yield showed positive and highly significant correlation with spike length (rg = 0.389), hectoliter weight (rg = 0.450), biological yield (rg = 0.300), and harvest index (rg = 0.784). Similarly, grain yield had positive and highly significant genotypic correlation with 1000-kernel weight and biological yield in all environments (Azeb et al., 2016) and with biological yield and plant height at the genotypic level (Amardeep et al., 2017). However, lodging (rg = -0.509) and percent of protein (rg = -0.563) had negatively high significant correlation with grain yield (Table 3) which was also similarly reported by Negash et al. (2019). Azeb et al. (2016) also reported negative and highly significant genotypic correlation of grain yield with days to heading and days to maturity. This might be due to the presence of common genetic elements that controlled the characters in the same and/or in different direction. The observed significant positive correlation could be either due to the strong coupling linkage between the genes or was the result of pleiotropic genes that controlled these characters in the same direction (Kearsey and Pooni, 1996). The yield components exhibited varying trends of association among themselves. In contrast to the current result, Singh (2014) reported the presence of negative correlation between grain yield and plant height. The work of Surma et al. (2012) showed positive and significant correlation of grain yield with thousand kernel weight, hectoliter weight and starch content. Therefore, positive correlation coefficients of grain yield with most of the traits implied that, improving one or more of these traits could result in high grain yield (Yagdi and Sozen, 2009). Further more, plant height had positive significant association with number of kernels per spike, number of spikelets per spike, spike length, and hectoliter weight. Spike length had positive and highly significant correlation with biological yield, and harvest index. The correlation of hectoliter weight,with plant height, number of kernels per spike, number of spikelets per spike, harvest index and spike length was positive and significant.number of kernels per spike had positive and significant correlation with grain yield, hectoliter weight, plant height and biological yield (Table 3). The positive significant associations between grain yield and plant height because of these tall genotypes generally excelled in their capacity to support kernel growth by stem reserve mobilization (Blum et al., 1989). Therefore, selection for tall plants tends to increase grain yield per plant. @ IJTSRD | Unique Paper ID – IJTSRD28112 | Volume – 3 | Issue – 6 | September - October 2019 Page 317
International Journal of Trend in Scientific Research and Development (IJTSRD) @ www.ijtsrd.com eISSN: 2456-6470 Table3. Phenotypic (rp) and genotypic (rg) correlation coefficients of studied traits of durum wheat accessions evaluated in 2018 season G Y Traits DH DM GFP PH BY HI SWT TKW NKPS NSPS SL GLT MTR PRT HLW WAB 0.389* * 0.359* * - - GY rg 1 -0.019 0.111 0.098 0.267* 0.300** 0.784** 0.082 -0.094 0.208* 0.091 -0.080 0.450** 0.003 0.231* - 0.221* 0.563** - 0.548** rp -0.007 0.106 0.086 0.217* 0.297** 0.790** 0.069 -0.09 0.175* 0.080 -0.057 0.443** 0.004 - - - DH rg 1 0.631 ** - 0.630 ** 0.809 ** 0.806 ** -0.030 -0.022 0.001 -0.008 -0.103 -0.019 -0.148 0.092 0.051 0.127 -0.070 0.132 0.055 0.025 - - rp -0.026 -0.023 0.011 -0.003 -0.080 0.007 -0.144* 0.088 0.025 0.120 -0.068 0.122 0.049 0.015 0.295* * 0.284* * DM rg 1 -0.044 0.050 0.113 0.054 0.063 -0.020 0.002 0.109 -0.022 -0.050 -0.067 0.100 rp -0.034 0.047 0.108 0.045 0.062 -0.020 -0.016 0.103 -0.016 -0.056 -0.067 0.099 GFP rg 1 -0.017 0.052 0.088 0.056 0.054 0.045 0.013 0.171 -0.071 -0.070 -0.127 0.118 0.151 rp -0.010 0.050 0.077 0.044 0.050 0.032 -0.017 0.166* -0.064 -0.058 -0.123 0.117 0.148 PH rg 1 0.339* -0.015 0.041 0.033 0.253* 0.214* 0.356* -0.069 -0.020 -0.249* 0.221* 0.094 0.317* * 0.501* * 0.484* * rp 0.310** -0.021 0.034 0.025 0.216* 0.158* -0.058 -0.022 -0.234* 0.206* 0.081 - BY rg 1 -0.300* 0.052 -0.140 0.294* 0.279* -0.060 -0.254* 0.408** 0.102 0.204* - 0.193* - - rp 0.036 0.247* 0.236* -0.018 -0.246* 0.408** 0.106 0.293** 0.140* - HI rg 1 0.040 -0.028 0.009 -0.062 0.034 -0.180 -0.020 0.212* -0.031 0.438** - 0.426** - rp 0.031 -0.026 0.001 -0.050 0.027 -0.015 0.209* -0.030 0.172* SWT rg 1 0.119 -0.124 0.099 0.222* -0.050 -0.017 -0.042 0.061 0.001 rp 0.118 0.027 0.131 0.102 -0.086 -0.179* -0.072 0.048 -0.036 TKW rg 1 -0.089 -0.119 -0.081 -0.100 0.136 0.091 -0.075 0.010 rp -0.07 -0.093 -0.083 -0.102 0.089 0.086 -0.075 0.007 0.507* * 0.453* * - NKPS rg 1 0.152 -0.030 -0.253* 0.231* -0.029 0.223* - 0.250* - 0.248* - 0.227* - rp -0.002 -0.254* 0.194* 0.004 0.272** NSPS rg 1 0.145 0.002 -0.299* 0.256* -0.034 rp 0.073 -0.053 -0.265* 0.215* 0.122 SL rg 1 -0.085 -0.110 -0.217* 0.340* 0.193 0.284* * rp -0.037 0.097 -0.169* 0.330** - - GLT rg 1 0.554** -0.071 0.384** 0.395** - 0.382** rp -0.216* 0.551** -0.030 MTR rg 1 0.045 -0.046 0.141 rp 0.096 -0.020 0.151 - PRT rg 1 -0.013 0.602** - 0.594** rp -0.036 HLW rg 1 -0.004 rp 0.007 WAB Key : BY= biological yield tons ha-,1 DH= days to heading, DM= days to maturity, GLT= gluten (%), GFP = grain filling period, GY = grain yield tons ha-,1,HI = harvest index (%), HLW= hectoliter weight (kg hl-1), MTR= moisture (%),NKPS= number of kernels per spike, NSPS=number of spikelets per spike,PH = plant height(cm), PRT= protein (%),SL= spike length(cm), SW = spike weight(g), TKW = thousand kernels weight(g), and WAB=water obsorption (%) Path coefficient analysis Both phenotypic and genotypic correlations were analyzed by path coefficient analysis technique to identify the important yield attributes by estimating the direct effects of traits contributing to grain yield and separating the direct from the indirect effects through other related traits by partitioning the correlation coefficient and finding out the relative importance of different characters as selection criteria. This analysis was conducted using grain yield as dependent variable and all other traits studied as independent (causal) variables. In this study, grain yield was the result of plant height, biological yield, harvest index, number of kernels per spike and spike length (Tables 4 and 5). Genotypic path coefficient Harvest index had positive and significant correlation coefficient and it showed the highest positive direct effect (0.93) on grain yield. Harvest index has also showed large indirect effects Plant height, biological yield, number of kernels per spike, spike length, gluten and hectoliter weight than other characters included in the analysis showing its high contribution for abetter partitioning of the photosynthetic products into the grain. The direct effect of biological yield followed by spike 1 @ IJTSRD | Unique Paper ID – IJTSRD28112 | Volume – 3 | Issue – 6 | September - October 2019 Page 318
International Journal of Trend in Scientific Research and Development (IJTSRD) @ www.ijtsrd.com eISSN: 2456-6470 length, Plant height, number of kernels per spike, hectoliter weight, and gluten on grain yield was positive with significant correlation and so exerted positive direct effect (Table 4). Biological yield, Harvest index, Plant height and spike length revealed positive direct effect and had positive genetic correlation explaining the existence of real relation between the characters and yield indicating that, indirect selection of yield via this characteristic is effective. Similarly, Negash et al. (2019) reported positive direct effect of the biological yield on grain yield in Ethiopian barley landraces. Azeb et al. (2016) indicated that biological yield exerted maximum positive direct effect on grain yield across locations. ). The studies made by Kifle et al. (2016), Kole (2006) and Anwar et al. (2009) showed that grain yield per plant had positive and significant correlations with spike length, biological yield, harvest index, number of kernels per spike and plant height both at genotypic and phenotypic levels. Protein exerted negative direct effects on grain yield also negative and highly significant association at genotypic levels. The indirect effects of protein with other characters were mostly negatives and negligible. Singh and Chaundhary (1985) suggested that an indirect effect seemed to be the cause of correlation and hence, these indirect causal factors (traits) should be considered simultaneously for selection (Table 4).Besides to significant, Plant height, biological yield, harvest index, number of kernels per spike, spike length, gluten and hectoliter weight exhibited positive direct effects on grain yield indicating that, increasing in those traits could possibly to increase grain yield. The genotypic residual value (0.04) showed that, the characters under study accounted for 96 % of the variability with grain yield components (Table 4). Table4: Estimates of direct (bold diagonal) and indirect effect (off-diagonal) at genotypic level of 8 traits on grain yield of 100 durum wheat accessions Traits PH BY HI NKPS PH 0.05 0.12 -0.01 0.01 BY 0.01 0.52 -0.20 0.01 HI 0.00 -0.11 0.93 0.00 NKPS 0.01 0.10 0.01 0.05 SL 0.01 0.18 0.02 0.01 GLT 0.00 -0.07 -0.12 -0.01 PRT -0.01 -0.09 -0.29 -0.01 HLW 0.01 0.14 0.14 0.01 Key: BY = biological yield tons ha-1, GLT= gluten (%), rg =genotypic correlations, HI = harvest index (%), HLW= hectoliter weight (kg hl-1), KNPS=kernel number per spike, PH=plant height, PRT =protein (%), residual effect = 0.04 is unexplained, 0.96 is explained and SL=spike length Phenotypic path coefficient analysis Harvest index and biological yield showed positive and significant correlation (r = 0. 79) and (r = 0.30) with grain yield and they had the highest direct effect (0.94) and (0.53) on grain yield respectively. The existence of negligible and positive indirect effect of harvest index and biological yield with most of the other characters determines that, the correlation of these traits with grain yield were found to be due to the direct effect (Table 5). Plant height, spike length, number of kernels per spike, gluten and hectoliter weight have positive and negligible direct effect on grain yield and the phenotypic correlation they had with grain yield were positive. The indirect effect of harvest index through Plant height, spike length, number of kernels per spike, gluten and hectoliter and biological yield counter balanced the direct effect harvest index on grain yield. The indirect effect of biological yield through harvest index (-0.20) counter balanced the direct effect of biological yield on grain yield (0.53). The residual value (0.05) showed the characters under the study accounted 95% of the variability in grain yield (Table 5). Table5: Estimates of direct (bold diagonal) and indirect effect (off-diagonal) at phenotypic level of 8 traits on grain yield of 100 durum wheat accessions Traits PH BY HI NKPS PH 0.05 0.12 0.00 0.01 By 0.01 0.53 -0.20 0.01 HI 0.00 -0.11 0.94 0.00 NKPS 0.01 0.10 0.00 0.05 SL 0.01 0.19 0.02 0.00 GLT 0.00 -0.07 -0.10 -0.01 PRT -0.01 -0.10 -0.30 -0.01 HLW 0.01 0.16 0.15 0.01 Key: BY = biological yield tons ha-1, GLT= gluten (%), HI = harvest index (%) , HLW= hectoliter weight (kg hl-1), KNPS=kernel number per spike, PH=plant height, PRT =protein (%), rp = phenotypic correlations residual effect = 0.05 is unexplained, 0.95 is explained and SL=spike length SL 0.01 0.02 0.00 0.01 0.08 0.00 -0.01 0.01 GLT 0.00 -0.01 -0.01 -0.01 0.00 0.05 0.03 -0.02 PRT 0.01 0.01 0.01 0.01 0.01 -0.01 -0.01 -0.03 -0.02 -0.56** 0.02 0.04 HLW 0.01 0.01 0.01 0.01 0.01 rg 0.27* 0.46* 0.78** 0.21* 0.39** -0.23* 0.45** SL 0.01 0.00 0.02 0.00 0.00 0.00 0.00 0.00 0.07 0.00 0.00 0.06 0.00 0.03 -0.03 -0.02 -0.55** 0.01 0.00 0.02 GLT PRT 0.01 0.01 0.01 0.01 0.00 0.00 HLW 0.01 0.01 0.01 0.01 0.01 -0.01 rp 0.22* 0.30** 0.79** 0.17* 0.36** -0.22* 0.03 0.44** @ IJTSRD | Unique Paper ID – IJTSRD28112 | Volume – 3 | Issue – 6 | September - October 2019 Page 319
International Journal of Trend in Scientific Research and Development (IJTSRD) @ www.ijtsrd.com eISSN: 2456-6470 Conclusions Study of relationship between yield and yield contributing characters in durum wheat through genotypic and phenotypic correlations suggests that grain yield (t ha-1) had shown significant and highly significant (P<0.05 and P<0.01) and positive phenotypic and genotypic correlation with thousand Plant height, biological yield, harvest index, number of kernels per spike, spike length, gluten and hectoliter weight had positive. Thus implies that the genetic influence on these traits was similar and grain yield could be improved directly by improving these traits. Grain yield had positive but not significant correlation at genotypic and phenotypic level with number of spikelet per spike, spike weight and water obsorption. Generally, significant differences of the characters showed that, there is substantial amount of genetic variation among the studied materials and is a strong correlation between most of the studied desirable characters that can afford basic information for further breeding activities for crop improvement. ACKNOWLEDGMENTS The authors greatly acknowledge the Agricultural Growth Programme (AGP-II) and Oromia Agricultural Research Institute (OARI) for the financial support. Haro-Sebu Agricultural Research Center staff members are greatly acknowledged for the technical support. Ethiopia Biodiversity Institute (EBI) is also acknowledged for the provision of durum wheat accessions. REFERENCES [1]Ahmed, H. M., Khan, B. M, Khan, S., Sadiq Kissana, N., & Laghari, S. (2003). Path coefficient. [8]Birhanu, M., Sentayehu, A., Alemayehu, A., Ermias, A., & Dargicho, D. (2016). Genetic variability, heritability and genetic advance for yield and yield related traits in bread wheat (Triticum aestivum L.) genotypes. Global Journal Science Research, 16(7), 12-15. [9]Blanco, A., Rajaram, S., & Kronstad, W.E. (2010). Agronomic potential of some barley genotypes. Crop Science, 41, 670-676 [10]Blum, A., Golan, G., Mayer, J., Sinmena, B., Shpiler, L., & Burra, J (1989). The drought response of landraces of wheat from the northern negev desert in Israel. Euphytica, 4, 87-96. [11]Central Statistical Agency (CSA). (2018). The Federal Democratic Republic of Ethiopia Agricultural Sample Survey Area and production of major crops (private peasant holdings,). Vol, I. Addis Ababa, Ethiopia [12]Colomba, M. S., & Gregorini, A. (2011). Genetic diversity analysis of the durum wheat Graziella Ra, Triticum turgidum L. Husn.(Poales, Poaceae). Biodiversity Journal, 2(2), 73- 84. subsp. durum (Desf.) [13]Dewey, D. R., & Lu, K. (1959). A correlation and path- coefficient analysis of components of crested wheatgrass seed production. Agron.J, 51, 515-18. [14]Dhami, N. B., Kandel, M., Gurung, S. B., & Shrestha, J. (2018). Agronomic performance and correlation analysis of finger millet genotypes (Elusine coracana L.). Malaysian J. Sustain. Agric, 2, 16-18. [15]Grafius, J. E. (1960). Does overdominance exist for yield in corn? Agron. J, 52, 361. [16]Hailu, G. M., Tanner, D. G., & Mengistu, H. (1991). Bread Wheat Breeding and Genetics Research in Ethiopia: A Historical Perspective. Addis Ababa, IAR/CIMMYT. [2]Amardeep, L., Singh, V., & Piyushmalik (2017). Studies on correlation and path coefficients analysis in barley (Hordeum vulgare L.). Bulletin of Environment, Pharmacology and Life Sciences, 6(12), 75-80. analysis in bread wheat. Asian J. Plant Sci, 2, 491-94. [17]Kahrizi, D., Cheghamirza, K., Kakaei, M., Mohammadi, R., & Ebadi, A. (2010a). Heritability and genetic gain of some morphophysiological variables of durum wheat (Triticum turgidum var. durum). African Journal of Biotechnology, 9(30), 4687-4691. [3]Anwar, J., Ali, M. A., Hussain, M., Sabir, W., Khan, M. A., & Zulkiffal, M, et al (2009). Assessment of yield criteria in bread wheat through correlation and path analysis. Journal of Animal and Plant Sciences, 19(4), 185-188. [18]Kahrizi, D., Maniee, M., Mohammadi, R., & Cheghamirza, K. (2010b). Estimation of genetic parameters related to morpho-agronomic traits of Durum Wheat (Triticum turgidum var. durum). Biharean Biologist, 4(2), 93-97. [4]Azeb, H., Sentayehu, A., Mandefro, N., & Ermias, A. (2016). Correlation and path poefficient analysis of yield and yield associated traits in barley (Hordeum vulgare L.) Germplasm. Advances in Crop Science and Technology, 1-7. [19]Kalimullah, S., Khan, J., Irfaq, M., & Rahman, H. U. (2012). Gentetic variability, correlation and diversity studies in bread wheat (Triticum aestivum L.) germplasm. Journal Animal. Plant Sciences, 22(2), 330-333 [5]Bergh, J., & Löfström, J. (2012). Interpolation spaces: an introduction (Vol. 223). Springer Science & Business Media. [20]Kandel, M., Ghimire, S. K., Ojha, B. R. & Shrestha, J. (2018b). Genetic diversity for heat tolerant related traits in maize inbred lines. Agricultura, 105, 23-34. [6]Bhujel, J., Sharma, S., Shrestha, J., & Bhattarai, A. (2018). Correlation and path coefficient analysis in normal irrigated rice (Oryza sativa L.). Fmg. & Mngmt. 3, 19-22. [21]Kandel, M., Ghimire, S. K., Ojha, B. R., & Shrestha, J. (2018a). Correlation and path coefficient analysis for grain yield and its attributing traits of maize inbred lines (Zea mays L.) under heat stress condition. Int.J. Agric. Environ. and Food Sci, 2, 124-30. [7]Bhutta, W. M., Tahira, B.,& Ibrahim, M. (2005). Path- coefficient analysis of some quantitative characters in husked barley. Universidade de Santa Cruz do Sul, 17(1), 65-70. Caderno de PesquisaSØr. @ IJTSRD | Unique Paper ID – IJTSRD28112 | Volume – 3 | Issue – 6 | September - October 2019 Page 320
International Journal of Trend in Scientific Research and Development (IJTSRD) @ www.ijtsrd.com eISSN: 2456-6470 [22]Kashiani, P., & Saleh, G (2010). Estimation of genetic correlations on sweet corn inbred lines using SAS mixed model. American Journal of Agricultural and Biological Sciences, 5(3), 309-314. drought conditions. International Journal Plant Production, 4(1), 11-24. [36]Naik, V.R., Biradar, S.S., Yadawad, A., Desai, S.A., & Veeresha, B.A. (2015). Study of genetic variability parameters in bread wheat (Triticum aestivum L.) genotypes. Research Journal Agricultural Science, 6(1), 123-125. [23]Kearsey, MJ., & Pooni, HS (1996). The Genetic Analysis of Quantitative Traits. Chapman and Hall, London, Weinhein, New York. [24]Khan, M., H., & Dar, A. N. (2010). Correlation and path coefficient analysis of some quantitative traits in wheat. African Crop Sci. J, 18, 9-14. [37]Negash, G., Dagnachew, L., & Zerihun, J. (2019). Correlations and path Analysis of some quantitative characters in barley (Hordeum vulgareum L.) landraces in western Oromia, Ethiopia. Africa Journal of Plant Sciences, 13(2), pp 34-46 [25]Kharel, L., Ghimire, S. K., Shrestha, J., Kunwar, C. B., & Sharma, S. (2018). Evaluation of rice genotypes for its response to added fertility levels and induced drought tolerance during reproductive phase. J. AgriSearch, 5, 13-18. [38]Phougat, D., Panwar, I. S., Saharan, R. P., Singh, V., & Godara, A. (2017). Genetic diversity and association studies for yield attributing traits in bread wheat [Triticum aestivum (L.) em.Thell]. [26]Kifle, Z., Firew, M., & Tadesse, D. (2016). Estimation of association among growth and yield related traits in bread wheat (Triticum aestivum L.) genotypes at Gurage Zone Ethiopia. International Journal Plant Breeding Crop Sciences, 3(2), 126-132. [39]Rahman, M.A., Kabir, M.L., Hasanuzzaman, M., Rumi, R.H., & Afrose, M.T. (2016). Study of variability in bread wheat (Triticum aestivumL.). .International Journal Agricultural Researh, 8, 66-76. [27]Kifle, Z., Firew, M., & Tadesse, D. (2016). Estimation of association among growth and yield related traits in bread wheat (Triticum aestivum L.) genotypes at Gurage Zone Ethiopia. International Journal Plant Breeding Crop Sciences, 3(2), 126-132. [40]Robertson, A (1959). The sampling variance of the genetic correlation coefficient. Biometrics, 15(3), 469-485. [41]SAS Institute Inc (2008). Statistical analysis Software version 9.2, Cary, NC: SAS Institute. [28]Kole, P. C. (2006). Variability, correlation and regression analysis in third somaclonal generation of barley. Barley Genetics Newsletter, 36, 44-47. [42]Sharma, JR (1998). Statistical and biometrical techniques in plant breeding. New Delhi, New Age International (P) limited, publishers. [29]Kumar, P., Singh, G., Kumar, S., Kumar, A., & Ojha, A. (2016). Genetic analysis of grain yield and its contributing traits for improvement of bread wheat cultivars. Journal Applied Natural Sciences, 8(1), 350-357. [43]Shashikala, S.K. (2006). Analysis of genetic diversity in wheat. M.Sc. Thesis University of Agricultural Sciences Dharwad India. their implications in [44]Singh, R. K., & Chaudhary, B.D. (1985). Biometrical methods in quantitative analysis. New Delhi, Kalyani, Publishers. [30]Lidansky, T. (1988). Statistical Methods in the Biology and in the Agriculture. Zemizdat, Sofia. [45]Singh, RK., & Chaudhary, BD (1999). Biometrical methods in quantitative genetics analysis. New Delhi, Kalyani Publishers. [31]Maccaferri, M., Cane, M.A., & Sanguineti, M.C. (2014). A consensus framework map of durum wheat (Triticum durum Desf) disequilibrium analysis association mapping. BMC Genomics, 15(1), 1 suitable and for genome-wide linkage [46]Singh, S. (2014). Genetic variation for protein content and its association with yield related traits in recombinant inbred lines (RILs) population of bread wheat (Triticum aestivum L. Em. Thell). M.Sc.Thesis CCSHAU Hisar [32]Maniee, (2009).Genetic physiological traits in Durum wheat (Triticum turgidum var. durum), Journal. Applied. Sciences, 9(7), 1383-1387. M., Kahrizi, variability D., & of Mohammadi, some R. morpho- [47]Surma, M., Adamski, T., Banaszak, Z., Kaczmarek, Z., Majcher, M., & Krystkowiak, K. (2012). Effect of genotype, environment and their interaction on quality parameters of wheat breeding lines of diverse grain hardness. Plant Production.Science, 15(3), 192- 203. [33]Miller, PA., Williams, JC., Robinson, HF.,& Comstock, RE (1958). Estimates Environmental Variances and Covariance in Upland Cotton and Their Implications in Selection 1. Agronomy Journal, 50(3), 126-131. of Genotypic and [48]Tesfaye, T. (1986). Improvement of indigenous durum wheat landraces in Ethiopia. In:Engels JMJ (ed.). Proceedings of the international Symposium, Addis Ababa, Ethiopia, 232-238. [34]Milligan, S. B., Gravois, K. A., Bischoff, K. P., & Martin, F. A. (1990). Crop effect on genetic relationships among sugarcane traits. Crop Sci, 30, 927-31. [49]Yağdı, K., & Sözen, E. (2009).Heritability, variance components and correlations of yield and quality traits in durum wheat (Triticum durum Desf.). Pak. Journal. Bot., 41(2), 753-759. [35]Mohammadi, R., Armion, M., Kahrizi, D., & Amri, A. (2010). Efficiency of screening techniques for evaluating durum wheat genotypes under mild @ IJTSRD | Unique Paper ID – IJTSRD28112 | Volume – 3 | Issue – 6 | September - October 2019 Page 321