Download
1 / 8
80 likes | 100 Views
Research has become a core areas in higher education. There are number of government grants to promote research in various fields. In recent years, many universities and funding authorities have adopted research integrity policies LaFollette, 1992 Duquet, 1993 .Research productivity should be the main highlight for any faculty who want to be a part of competitive advantage. A model is created wherein it is stated that research push and right mind set can lead one to attain competitive advantage in an environment which it is very competitive. The survey was based on primary data. Only women faculties were targeted for this survey. Out of total 167 sample, 83 respondents were married and 82 respondents were spinsters. Divorcee were nil hence they were excluded from the study. Different colleges were surveyed according to the prescribed time given by them. Hence a field research was done through personal and group interview. As the study was a diagnostic surveys so fact findings enquiries were executed through cross tabulation, skewness and kurtosis and normal Q Q plots. Some significant facts have been observed from this study. This research paper is also based on secondary data for finalization of views and opinions which has been sourced from published literature. Dolan Champa Banerjee | Dr. Yathish Kumar "Research and Competitive Advantage: A Descriptive Study on Engineering Faculty" Published in International Journal of Trend in Scientific Research and Development (ijtsrd), ISSN: 2456-6470, Volume-2 | Issue-5 , August 2018, URL: https://www.ijtsrd.com/papers/ijtsrd17044.pdf Paper URL: http://www.ijtsrd.com/management/hrm-and-retail-business/17044/research-and-competitive-advantage-a-descriptive-study-on-engineering-faculty/dolan-champa-banerjee<br>

E N D
International Research Research and Development (IJTSRD) International Open Access Journal nd Competitive Advantage: A Descriptive Study o Engineering Faculty Dolan Champa Banerjee1, Dr. Yathish Kumar2 Assistant Professor,2Associate Professor& Research Guide St. Agnes College (Autonomous), 2Department of Commerce, University College, Mangaluru,Karnataka, India research in various fields. In universities and funding authorities have adopted research integrity policies (LaFollette, 1992; Duquet, 1993). It not only gives individual satisfaction but also benefit the society at large. Today universities are very aggressive in taking up research so that they build their USP and can attract stakeholders. Universities in Canada as in other countries have been increasingly expected to serve more purposes and audiences, extending their core missions to new areas and clienteles, even as they face resource constraints (Fallis 2007). The Social Sciences and Humanities Research Council (SSHRC) has promoted knowledge mobilization, as have other important sponsors of education research (SSHRC 2009; Levin 2008). Olatokunbo Christopher Okiki research productivity of the teaching faculty members in Nigerian federal universities is high in journal publications, technical reports, conference papers, working papers, and occasional papers. The research productivity is higher in SD=25.73), and Southwest (M=21.74; SD=87.28), and North Central (M=20.69; SD=31.24) Nigeria. Also, the mean score of information resources availability (M=2.41; SD=0.90) indicates that information resources are readily available to tea faculty members in Nigerian federal universities. The barriers to research productivity by teaching faculty members in the universities include low Internet bandwidth (M=3.793; SD=1.162) and financial constraint (M=3.543; SD=1.257). Besides, the stud has shown the strengths and weaknesses of the has shown the strengths and weaknesses of the International Journal of Trend in Scientific Scientific (IJTSRD) International Open Access Journal ISSN No: 2456 ISSN No: 2456 - 6470 | www.ijtsrd.com | Volume 6470 | www.ijtsrd.com | Volume - 2 | Issue – 5 Research and Competitive Advantage: A Descriptive Study on Engineering Faculty Dolan Champa Banerjee 1Assistant Professor 1St. Agnes College (Autonomous) f Commerce, University College, ABSTRACT Research has become a core areas in higher education. There are number of government grants to promote research in various fields. In recent years, many universities and funding authorities have adopted research integrity policies (LaFollette, 1992; Duquet 1993).Research productivity should be the main highlight for any faculty who want to be a part of competitive advantage. A model is created wherein it is stated that research push and right mind lead one to attain competitive advantage in an environment which it is very competitive. The survey was based on primary data. Only women faculties were targeted for this survey. Out of total 167 sample, 83 respondents were married and 82 respondents were spinsters. Divorcee were nil hence they were excluded from the study. Different colleges were surveyed according to the prescribed time given by them. Hence a field research was done through personal and group interview. As the study was a diagnostic surveys so fact findings enquiries were executed through cross tabulation, skewness and kurtosis and normal Q-Q plots. Some significant facts have been observed from this study. This research paper is also based on secondary data for finalization of views and opinions which has been sourced from published literature. Keywords: Faculty, Research productivity, higher education, Model, Engineering College 1. INTRODUCTION Research has become a core areas in higher education. There are number of government grants to promote There are number of government grants to promote Research has become a core areas in higher education. There are number of government grants to promote research in various fields. In recent years, many universities and funding authorities have adopted research integrity policies (LaFollette, 1992; Duquet, 1993).Research productivity should be the main highlight for any faculty who want to be a part of competitive advantage. A model is created wherein it is stated that research push and right mind-set can lead one to attain competitive advantage in an ronment which it is very competitive. research in various fields. In recent years, many universities and funding authorities have adopted research integrity policies (LaFollette, 1992; Duquet, 1993). It not only gives individual satisfaction but also benefit the society at large. Today universities are king up research so that they build their USP and can attract stakeholders. Universities in Canada as in other countries have been increasingly expected to serve more purposes and audiences, extending their core missions to new areas s they face resource constraints (Fallis 2007). The Social Sciences and Humanities Research Council (SSHRC) has promoted knowledge mobilization, as have other important sponsors of education research (SSHRC 2009; Levin 2008). The survey was based on primary data. Only women faculties were targeted for this survey. Out of total 167 sample, 83 respondents were married and 82 respondents were spinsters. Divorcee were nil hence excluded from the study. Different colleges were surveyed according to the prescribed time given by them. Hence a field research was done through personal and group interview. As the study was a diagnostic surveys so fact findings enquiries were hrough cross tabulation, skewness and Q plots. Some significant facts have been observed from this study. This research paper is also based on secondary data for finalization of views and opinions which has been sourced from Olatokunbo Christopher Okiki (2013) show that the research productivity of the teaching faculty members in Nigerian federal universities is high in journal publications, technical reports, conference papers, working papers, and occasional papers. The research Northeast (M=22.53; SD=25.73), and Southwest (M=21.74; SD=87.28), and North Central (M=20.69; SD=31.24) Nigeria. Also, the mean score of information resources availability (M=2.41; SD=0.90) indicates that information resources are readily available to teaching faculty members in Nigerian federal universities. The barriers to research productivity by teaching faculty members in the universities include low Internet bandwidth (M=3.793; SD=1.162) and financial constraint (M=3.543; SD=1.257). Besides, the study productivity, higher Research has become a core areas in higher education. @ IJTSRD | Available Online @ www.ijtsrd.com @ IJTSRD | Available Online @ www.ijtsrd.com | Volume – 2 | Issue – 5 | Jul-Aug 2018 Aug 2018 Page: 1574
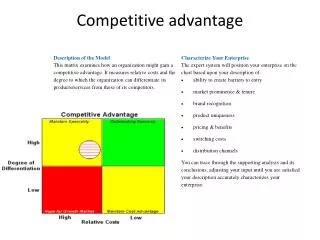
International Journal of Trend in Scientific Research and Development (IJTSRD) ISSN: 2456-6470 teaching faculty members in Nigerian universities in terms of their research output. Fadia Nasser and Arin Majdob examined the relationship between teacher educators' research productivity (RP) and their background and professional characteristics, obstacles and time devoted to research. The findings indicate the significance of five variables for predicting RP: academic degree, rank, administrative position, desire to develop new knowledge and learn from research findings and perceived insufficient research competence and self-confidence. These variables should be addressed when recruiting teacher educators, assigning administrative duties and designing professional particularly for new career faculty. COMPETITIVE ADVANTAGE The basis meaning of competitive advantage is putting oneself in the favorable conditions by reading, listening, observing, exploring and thinking. It is not a one day job. It really takes a lot of time to build ones competitive advantage. But if little bit is learnt everyday then there can be horizontal and vertical expansion of knowledge (Dolan 2017). Learning should be a habit which will help one to explore new notion, new thought process, new dimensions, new mindset which eventually will lead to competitive advantage. Today every walks of life is competitive. To stay in this competitive world one has to be dynamic, aggressive and a constant learner. 1.1 CONCEPTUAL FRAMEWORK competitive advantage in an environment which it is very competitive. 1.2 PURPOSE ?To analyse whether financially support their faculty for research. ?To focus on various learning opportunities in engineering colleges. ?To find the correlation between self-learning and research. ?To analyse the level of socializing among faculty. ?To extract whether working condition have an impact on research productivity. 2. METHODS 2.1 PARTICIPANTS AND PROCEDURE The survey was based on primary data. Only women faculties were targeted for this survey. Out of total 167 sample, 83 respondents were married and 82 respondents were spinsters. Divorcee were nil hence they were excluded from the study. Different colleges were surveyed according to the prescribed time given by them. Hence a field research was done through personal and group interview. As the study was a diagnostic surveys so fact findings enquiries were executed through cross tabulation, skewness and kurtosis and normal Q-Q plots. Some significant facts have been observed from this study. This research paper is also based on secondary data for finalization of views and opinions which has been sourced from published literature. 2.2 INSTRUMENTS The target group was some specific engineering colleges in Mangalore. The overall design was a rigid one as a structured questionnaire was prepared for the same. A brief description was given to the target group so that to make them understand the purpose of the study. 2.3 RESEARCH QUESTIONS This paper analyses whether age, marital status and religion has an impact on college support for research, learning opportunities in college, organisation responds to the employees need positively, time for self- learning, socialising with friends and relatives and working conditions or not. Research question: 2.3.1 Is there a relation between marital status and college financially supports for research? engineering colleges attitudes, motives, development programs, Source: Researcher Model Research productivity should be the main highlight for any faculty who want to be a part of competitive advantage. A model is created wherein it is stated that research push and right mind-set can lead one to attain @ IJTSRD | Available Online @ www.ijtsrd.com | Volume – 2 | Issue – 5 | Jul-Aug 2018 Page: 1575
International Journal of Trend in Scientific Research and Development (IJTSRD) ISSN: 2456-6470 2.4 H01: There is no significant difference between marital status and college financially supports for research. 2.3.2 Is there a relation between marital status and learning opportunities in college? H02: There is no significant difference between marital status and learning opportunities in college. 2.3.3 Is there a relation between marital status and getting time for self- learning? H03: There is no significant relationship between marital status and getting time for self- learning. 2.3.4 Is there a relation between age and socialising a lot with relatives and friends? H04: There is no significant relationship between age and socialising a lot with relatives and friends. DATA ANALYSIS Demographic variable (Table 1) Variables Particulars Frequency Percentage Age Within 30 31-40 41- 50 Personal status Single Interpretation: Demographic categorised under two heads in the study. Age was further divided into 5 categories. But for the last two categories, respondents were absent hence it was excluded from the survey. In the same way personal status was also categorised under three heading but for divorcee respondents were absent hence excluded from survey. 128 28 09 83 82 77.5% 17.0% 05.5% 50.3% 49.7% Married variable was Tests of Normality (Table -2) Personal status 1 2 a. Lilliefors Significance Correction Kolmogorov-Smirnova Statistic df .185 85 .191 82 Shapiro-Wilk Statistic .900 .873 Sig. .000 .000 df 85 82 Sig. .000 .000 My college financially supports me for my research Interpretation: In the descriptive statistics, the Z value is analysed according to the personal status of the faculty. The value of skewness and kurtosis is calculated based on the personal status. The Z value of skewness and kurtosis of married respondent are -0.5708 and -1.6673 respectively. On the other hand the Z value of skewness and kurtosisof single respondent are -0.3458 and -2.1292 respectively. The Shapiro- Wilk test (p< 0.05) (Shapiro &Wilk 1965; Razali&Wah 2011). Hence null hypothesis is rejected. @ IJTSRD | Available Online @ www.ijtsrd.com | Volume – 2 | Issue – 5 | Jul-Aug 2018 Page: 1576
International Journal of Trend in Scientific Research and Development (IJTSRD) ISSN: 2456-6470 Interpretations: A visual inspection of Normal Q-Q plots showed that financial support for research were not normally distributed for both married and single respondents. Dots donot show along the line. This indicates data are not approximately normally distributed for both married and single respondents. The skewness and kurtosis of married respondents were -.149 (SE= .261) and -.862 (SE= .517) respectively. On the other hand, the skewness and kurtosis of single respondents were -.092 (SE= .266) and-1.120 (SE= .526) (Cramer, 1998, Cramer &Howitt 2004, Doane& Seward 2011). Test of Normality (Table 3) Marital status I do not get time for self-learning 1 2 a. Lilliefors Significance Correction Interpretation: In the descriptive statistics, the Z value is analysed according to the personal status of the faculty. The value of skewness and kurtosis is calculated based on the personal status. The Z value of skewness and kurtosis of married respondent are 0.1954 and -1.5338 respectively. On the other hand the Z value of skewness and kurtosis of single respondent are -1.2255 and -1.1159 respectively. The Shapiro- Wilk test (p < 0.05) (Shapiro &Wilk 1965; Razali&Wah 2011). Hence null hypothesis is rejected. Kolmogorov-Smirnova Statistic df .179 85 .265 82 Shapiro-Wilk Statistic .907 .877 Sig. .000 .000 df 85 82 Sig. .000 .000 @ IJTSRD | Available Online @ www.ijtsrd.com | Volume – 2 | Issue – 5 | Jul-Aug 2018 Page: 1577
International Journal of Trend in Scientific Research and Development (IJTSRD) ISSN: 2456-6470 Interpretations: A visual inspection of Normal Q-Q plots showed that time for self- learning were normally distributed for both married and single respondents. Dots show little deviation from the line. This indicates data are approximately normally distributed for both married and single respondents. The skewness and kurtosis of married respondents were .051 (SE= .261) and -.793 (SE= .517) respectively. On the other hand, the skewness and kurtosis of single respondents were -.326 (SE= .266) and -.587 (SE= .526) (Cramer, 1998, Cramer &Howitt 2004, Doane& Seward 2011). Test of Normality (Table 4) Age of the respondent I socialize with my relatives n friendsWithin 31-40 41-50 a. Lilliefors Significance Correction Interpretation: In the descriptive statistics, the Z value is analysed according to the age of the faculty. The value of skewness and kurtosis is calculated based on the personal status. The Z value of skewness and kurtosis within 30 years of age of the respondent are 3.1173 and 0.1276 respectively. On the other hand the Z value of skewness and kurtosis in the age group of 31- 40 years are 1.3548 and -0.6946 respectively. The Z value of skewness and kurtosis in the age group of 41- 50 years are -0.8451 and -0.2042. The Shapiro- Wilk test where p value is different among different age groups. Within age group 30 years (p < 0.05) (Shapiro &Wilk 1965; Razali&Wah 2011). Hence null hypothesis is rejected. The second and third case also (p < 0.05), hence rejection of null hypothesis is stated. Kolmogorov-Smirnova Statistic df .325 129 .273 29 .272 Shapiro-Wilk Statistic .834 .869 .805 Sig. .000 .000 .054 df 129 29 9 Sig. .000 .002 .024 30 9 @ IJTSRD | Available Online @ www.ijtsrd.com | Volume – 2 | Issue – 5 | Jul-Aug 2018 Page: 1578
International Journal of Trend in Scientific Research and Development (IJTSRD) ISSN: 2456-6470 @ IJTSRD | Available Online @ www.ijtsrd.com | Volume – 2 | Issue – 5 | Jul-Aug 2018 Page: 1579
International Journal of Trend in Scientific Research and Development (IJTSRD) ISSN: 2456-6470 Interpretations: A visual inspection of Normal Q-Q plots showed that time for socialising with relatives and friends were not normally distributed for different age groups starting from below 30 years of age till 41- 50 years of age. Dots do not show along the line. This indicates data are not approximately normally distributed among different age groups. The skewness and kurtosis within 30 years of age were 3.1173 (SE= .213) and 0.1276 (SE= .423) respectively. On the other hand, the skewness and kurtosis within age group of 31- 40 years of age were 1.3548 (SE= .434) and -0.6946 (SE= .845). The third category age group was between 41- 50 years of age where skewness is -0.8451 (SE= .717) and Kurtosis is -0.2042 (SE = 1.400) (Cramer, 1998, Cramer &Howitt 2004, Doane& Seward 2011). Table 5 Marital status * I get adequate learning opportunities in my college Cross-tabulation I get adequate learning opportunities in my college 3 15 16.3 17.6% Total 1 15 16.8 17.6% 2 48 45.3 56.5% 4 6 5 1 Count 85 85.0 100.0% Expected Count % within Marital status % within I get adequate learning opportunities in my college % of Total Count Expected Count % within Marital status % within I get adequate learning opportunities in my college % of Total Count Expected Count % within Marital status % within I get adequate learning opportunities in my college % of Total 5.6 7.1% 1.0 1.2% 1 45.5% 53.9% 46.9% 54.5% 50.0% 50.9% 9.0% 18 16.2 22.0% 28.7% 41 43.7 50.0% 9.0% 17 15.7 20.7% 3.6% 5 5.4 6.1% .6% 1 1.0 1.2% 50.9% 82 82.0 100.0% Marital status 2 54.5% 46.1% 53.1% 45.5% 50.0% 49.1% 10.8% 33 33.0 19.8% 24.6% 89 89.0 53.3% 10.2% 32 32.0 19.2% 3.0% 11 11.0 6.6% .6% 2 2.0 1.2% 49.1% 167 167.0 100.0% Total 100.0% 100.0% 100.0% 100.0% 100.0% 100.0% 19.8% 53.3% 19.2% 6.6% 1.2% 100.0% Chi-Square Tests Value df Asymp. Sig. (2-sided) Pearson Chi-Square .986a Likelihood Ratio .986 Linear-by-Linear Association .051 N of Valid Cases 167 a. 2 cells (20.0%) have expected count less than 5. The minimum expected count is .98. Symmetric Measures Phi Cramer's V N of Valid Cases 4 4 1 .912 .912 .821 Value Approx. Sig. .077 .077 167 .912 .912 Nominal by Nominal Interpretation: At 5% level of significance Asymp. Significance is greater than .05. Hence statistically insignificant. So we accept null hypothesis i.e. there is no significant association between marital status and getting adequate learning opportunities in respective colleges. Learning opportunities are same for both married and unmarried facul @ IJTSRD | Available Online @ www.ijtsrd.com | Volume – 2 | Issue – 5 | Jul-Aug 2018 Page: 1580
International Journal of Trend in Scientific Research and Development (IJTSRD) ISSN: 2456 International Journal of Trend in Scientific Research and Development (IJTSRD) ISSN: 2456 International Journal of Trend in Scientific Research and Development (IJTSRD) ISSN: 2456-6470 3. Age and personal status are the two independent variables taken in the study. Hence it is further divided into three and two categories respectively. Normality test was conducted by the entire four diverse hypotheses created for this study. hypothesis created was rejected in terms of marital status and college financially supports for research, marital status and learning opportunities in colleges, marital status and getting time for self lear age and socialising lot with relatives and friends. importance of research in higher education institutions is attributed to two main factors. First is the notion that research improves teaching (Middaugh, 2000) and contributes to development (Livingston, McCall &Morgado, 2009). 4. CONCLUSION Today the scopes for research in engineering college are wide. There are lot of government initiatives to push research to higher level. Today even corporate are coming forward to set in motion the concept of research. So, as research is becoming the core area in today’s higher education, colleges and management should give due importance to it. Many lecturers in engineering colleges do not involve themselves in full fledged research because of many reasons. Sometimes they don’t get financial support from the professional world. Secondly as they have to balance their work and family so intensely that time does not permit them to do research. Thirdly at times they lack self urg The Health Science Appointment, Promotion, and Tenure Committee (HLS/APT Committee, 2000) at the State University of New York proposed comprehensive guidelines for assigning weights to scholarly outputs. This committee suggested assigning five points to peer-reviewed articles, books and monographs in national/international journals; three points to peer-reviewed presentations, published presentations in national/international conferences, peer-reviewed chapters in published books, edited books and articles in regional, state, or local journals, and authorship of successful grant proposals; and one point to peer-reviewed presentations in regional, state or local conferences, development and publication of media or software materials in peer journals, authorship of unsuccessful grant proposals and other types of scholarly output. As in today’s cut throat competition research As in today’s cut throat competition research RESULTS AND DISCUSSIONS Age and personal status are the two independent variables taken in the study. Hence it is further divided into three and two categories respectively. Normality test was conducted by the entire four rse hypotheses created for this study. The entire hypothesis created was rejected in terms of marital status and college financially supports for research, marital status and learning opportunities in colleges, marital status and getting time for self learning and age and socialising lot with relatives and friends. The importance of research in higher education institutions is attributed to two main factors. First is the notion that research improves teaching (Middaugh, 2000) and contributes to development (Livingston, McCall &Morgado, 2009). productivity plays an important role. Opportunities and scope are many when we focus on engineering scientific research will definitely give faculty lot of competitive advantage. productivity plays an important role. Opportunities and scope are many when we focus on engineering colleges. More scientific research will definitely give faculty lot of competitive advantage. BIBLIOGRAPHY 1.Fallis, G. (2007). Multiversities, ideas, and democracy. Toronto: University of Toronto Press. 2.Dolan (2018). Constant Learning and Professional Advancement- An empirical study on Genius, Volume- VI, Issue 3.Levin, B. (2008). Thinking about knowledge mobilization. Paper presented at the Symposium of the Canadian Council on Learning and the Social Sciences and Humanities Research Council of Canada. 15-18 May 2008 4.SSHRC-Social Science, Humanities Research Council. (2009). Meeting of Ottawa, Canada: Author 5.Middaugh, M. F. (2000). Analyzing costs in higher education. New Directions for Instructional Research, No. 106, Jossey- 6.Swennen& M. van der Klink (Eds.), Becoming a teacher educator. Theory and practice for teacher educators. UK: https://doi.org/10.1007/978 7.Froyd, J. E., Wankat, P. C., & Smith, K. A. (2012). Five major shifts in 100 yea engineering education. Proceedings of the IEEE, 100, 1344–1360. 8.Smith, K. A. (2006). Continuing to build engineering education research capabilities. IEEE Transactions on Education, 49(1), 1 9.Streveler, R. A., & Smith, K. A. (2006). Conducting rigorous research in engineering education. Journal of Engineering Education, 95(2), 103–105. 10.Streveler, R. A., & K. A., Smith. (2010). From the margins to the mainstream: The emerging landscape of engineering education research. Journal of Engineering Educat 287. 11.Streveler, R., Borrego, M., & Smith, K. A. (2007). Moving from the scholarship of teaching and learning to educational research: An example from engineering. To Improve the Academy, 25, 139 149. Fallis, G. (2007). Multiversities, ideas, and democracy. Toronto: University of Toronto Press. Constant Learning and Professional pirical study on Faculties. VI, Issue- II, pp112-125 Levin, B. (2008). Thinking about knowledge mobilization. Paper presented at the Symposium of the Canadian Council on Learning and the Social Sciences and Humanities Research Council 18 May 2008 continuous continuous p professional Social Science, Humanities Research Council. (2009). Meeting of SSHRC leaders. Today the scopes for research in engineering college are wide. There are lot of government initiatives to push research to higher level. Today even corporate set in motion the concept of research. So, as research is becoming the core area in today’s higher education, colleges and management give due importance to it. Many lecturers in engineering colleges do not involve themselves in full research because of many reasons. Sometimes they don’t get financial support from the professional world. Secondly as they have to balance their work and family so intensely that time does not permit them to do research. Thirdly at times they lack self urge. Middaugh, M. F. (2000). Analyzing costs in higher education. New Directions for Instructional -Bass Publisher. Swennen& M. van der Klink (Eds.), Becoming a teacher educator. Theory and practice for teacher educators. UK: https://doi.org/10.1007/978-1-4020-8874-2_14 Springer. Springer. Froyd, J. E., Wankat, P. C., & Smith, K. A. (2012). Five major shifts in 100 years of engineering education. Proceedings of the IEEE, The Health Science Appointment, Promotion, and Tenure Committee (HLS/APT Committee, 2000) at the State University of New York proposed comprehensive guidelines for assigning weights to scholarly outputs. This committee suggested assigning reviewed articles, books and monographs in national/international journals; three reviewed presentations, published presentations in national/international conferences, reviewed chapters in published books, edited les in regional, state, or local journals, and authorship of successful grant proposals; and one reviewed presentations in regional, state or local conferences, development and publication of media or software materials in peer-reviewed als, authorship of unsuccessful grant proposals Smith, K. A. (2006). Continuing to build engineering education research capabilities. IEEE Transactions on Education, 49(1), 1–3. Streveler, R. A., & Smith, K. A. (2006). rous research in engineering education. Journal of Engineering Education, Streveler, R. A., & K. A., Smith. (2010). From the margins to the mainstream: The emerging landscape of engineering education research. Journal of Engineering Education, 99(4), 285– Streveler, R., Borrego, M., & Smith, K. A. (2007). Moving from the scholarship of teaching and learning to educational research: An example from engineering. To Improve the Academy, 25, 139– @ IJTSRD | Available Online @ www.ijtsrd.com Available Online @ www.ijtsrd.com | Volume – 2 | Issue – 5 | Jul-Aug 2018 Aug 2018 Page: 1581