Download
1 / 7
70 likes | 93 Views
Free Space Optical FSO communication is the transmission of optical signals through the atmosphere. This technology promises high wireless data rates, highly secured transmission, license free operation and immunity to electro magnetic interference. However, FSO reliability is decreased considerably by atmospheric conditions. In this paper, we characterize the Ghanaian atmospheric channel for FSO communication based on visibility statistic. We use Kruse's model to estimate atmospheric attenuation in India. The probability of outage on an FSO link is computed to determine the availability of the link. Our results show atmospheric attenuation as high as 150.95dB km and 128.2316dB km in the 850nm and 1550nm transmission window respectively. The average atmospheric attenuation in India for 850nm and 1550 nm wavelengths is below 2dB km. The Probability of encountering higher attenuation condition is low. Umar Fayaz Marazi | Rashmi Raj "Experimental Analysis of Optical Coherent Communication System in India Through Atmospheric Turbulence" Published in International Journal of Trend in Scientific Research and Development (ijtsrd), ISSN: 2456-6470, Volume-2 | Issue-6 , October 2018, URL: https://www.ijtsrd.com/papers/ijtsrd18291.pdf Paper URL: http://www.ijtsrd.com/engineering/electronics-and-communication-engineering/18291/experimental-analysis-of-optical-coherent-communication-system-in-india-through-atmospheric-turbulence/umar-fayaz-marazi<br>

E N D
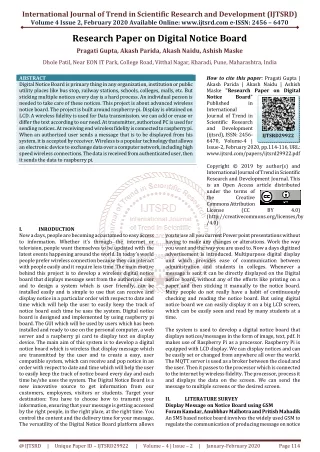
International Journal of Trend in Scientific Research and Development (IJTSRD) International Open Access Journal | www.ijtsrd.com ISSN No: 2456 - 6470 | Volume - 2 | Issue – 6 | Sep – Oct 2018 Experimental Analysis of Optical Coherent Communication System in India Through Atmospheric Turbulence Umar Fayaz Marazi1, Rashmi Raj2 1M.Tech Scholar, 2Assistant Professor Department of Electronics and Communication Engineering Universal Institute of Engineering & Technology, Mohali, Punjab India ABSTRACT Free Space Optical (FSO) communication is the transmission of optical atmosphere. This technology promises high wireless data rates, highly secured transmission, license-free operation and immunity to electro- magnetic interference. However, FSO reliability is decreased considerably by atmospheric conditions. In this paper, we characterize the Ghanaian atmospheric channel for FSO communication based on visibility statistic. We use Kruse’s model to attenuation in India. The probability of outage on an FSO link is computed to determine the availability of the link. Our results show atmospheric attenuation as high as 150.95dB/km and 128.2316dB/km in the 850nm and 1550nm respectively. The average atmospheric attenuation in India for 850nm and 1550 nm wavelengths is below 2dB/km. The Probability of encountering higher attenuation condition is low. Keyword: Free Space Optics, Specific Attenuation 1. INTRODUCTION The field of wireless communication has been extensively researched in order to exploit the ad- vantages it has over wired networks such as mobility and flexibility. The ever increasing band- width demand of present and emerging applications require high speed communication systems. The main challenge is to design more adaptive and scalable networks that can provide high data rates. Free Space Optical (FSO) communication has the potential to meet the huge bandwidth demand and can support a wide range of applications [1, 2]. The explosion of smart devices and the increasing bandwidth demand in India is the main motivation behind this research. Telecommunication companies in the country are investing huge sums of money for fiber optic cable installations for their backbone networks. The problem these companies face is installing cables in areas which have already developed residential infrastructure. Due to lack of national network infrastructural plan, these cables are destroyed during road constructions. In inaccessible areas, the companies are forced to depend on microwave links. Homes, small and medium scale organizations in India require high speed network but are deterred by the huge financial capital needed for fiber optic cables installations. FSO can be used to solve the last-mile connectivity problem associated with microwave. FSO can also be an alternative or backup to fiber optic cable. FSO is the transmission of high speed data using optical signals through the atmosphere. It requires a clear line-of-sight (LOS) between the transmitter and the receiver. FSO has more ad- vantages over traditional wireless communication systems. First, FSO can provide higher data rates than microwave communication systems. Second, it is highly immune to electromagnetic interference and highly secure with low probability of interception/low probability of detection (LPI/LPD) properties [3] due to the narrow beam width of optical signals. Typical laser beams used in FSO have diffraction limited divergence angle between 0.01 – 0.10mrad [4]. Laser beams can- not be detected with RF meters or spectrum analyzers [5]. Last, FSO does not require licensing for its operation which is a major cost advantage over microwave communication systems. However, FSO performance is limited by atmospheric conditions. Optical signals propagating through the signals through the estimate atmospheric transmission window @ IJTSRD | Available Online @ www.ijtsrd.com | Volume – 2 | Issue – 6 | Sep-Oct 2018 Page: 445
International Journal of Trend in Scientific Research and Development (IJTSRD) ISSN: 2456-6470 atmosphere turbulence (IRT), atmospheric absorption and scattering by fog, dust, smoke and rain- fall. Absorption can be avoided by proper selection of the transmission wavelength. Optical signals are scattered by atmospheric particles leading to reduction of optical power at the receiver as shown in Fig.1. suffer from index-of- refraction section, we will review existing work done in relation to atmospheric attenuation. In [7], E. Wainright et al investigated the use of wavelength diversity to alleviate effects caused by radiation and advection fog using MODTRAN simulation software. Information was encoded and transmitted on three carrier wavelengths, 0.85µm, 1.55µm and 10µm. The multiple carriers were combined and processed using Equal Gain Combining (EGC) and Selective diversity (SD) techniques. Simulation results showed significant increase in the power received in the case of EGC. However, 0.850µm and 1.55µm wave- lengths showed similar behavior when propagating through the same fog condition. Therefore the system is rendered redundant when SD technique is used. Again, 10µm wavelength laser equipment is not readily available for FSO design. E. Korevaar et al in [8], developed a simple model to estimate the outage probability of FSO systems. Visibility data from 10 cities in the US and 3 cities in the UK were used. The model is: Fig. 1 optical signal scattering FSO link’s availability is limited by dynamics of the local weather. Fog causes the most detrimental effects in FSO communication with attenuation of 480dBkm- 1 reported in [6]. The concentration and distribution of molecular and aerosol constituents of the atmosphere depends on the geographical area. The successful implementation of FSO communication therefore depends largely on the weather patterns of the area of deployment. It is therefore imperative to determine the level of attenuation caused by the local weather and assess its impact on the availability of FSO links in any geographical area. In this paper, we characterize the Ghanaian atmospheric channel for FSO communication. The specific attenuation caused by the local weather and probability of encountering these atmospheric attenuation conditions knowledge of the level of attenuation in a given area, the FSO system installer can choose the right system specifications. Again, knowing the probability of exceeding different atmospheric attenuation values in a given area, the system installer can predict the outage probability when the maximum attenuation the FSO product can withstand is known. Our approach is different from other works in that we analyze the attenuation conditions of the specific area of interest. The rest of the paper is organized as follows: Section II presents literature review; Section III discusses models for FSO transmission. In Section IV, the results of the investigation are pro- vided and Section V concludes the paper. II. RELATED WORK Numerous strategies have been proposed to evaluate attenuation caused by atmospheric conditions. In this Where A is the specific attenuation, the system availability was shown to decrease with increase in the link range. The drawback of this model is that the model does not consider the wavelength dependence of the attenuation even in high visibility conditions. The asymptotic value of 265dB reported was average specific attenuation in three UK cities. The weather condition of UK which is in the temperate zone is quite different from India. Hence the model may not be applicable to India. III. FSO TRANSMISSION MODELS The transmission of optical signals through the atmosphere can be modeled by the Beer- Lamberts law given as [9]: are investigated. With where (, L) the transmittance of the atmosphere; PT (, 0) the transmitted optical power; PR (, L ): the received optical power after a propagation distance, L; () : the atmospheric attenuation coefficient (km-1). The value of the atmospheric @ IJTSRD | Available Online @ www.ijtsrd.com | Volume – 2 | Issue – 6 | Sep-Oct 2018 Page: 446
International Journal of Trend in Scientific Research and Development (IJTSRD) ISSN: 2456-6470 attenuation wavelength; () is composed of both absorption and scattering terms expressed as: coefficient is dependent on the Assuming the aerosol particles are spherical in shape, the exact Mie Scattering theory can be applied to calculate the scattering cross-section, Cs, of the aerosol particle when the radius, r, of the particle is known. Thus the theoretical value of the normalized scattering efficiency, Qs, can be estimated as [11]: Where m ()molecular absorption coefficient; a () aerosol absorption coefficient; m () molecular scattering coefficient; a () aerosol scattering coefficient. Molecular absorption is a wavelength- selective phenomenon and can be avoided by the proper selection of wavelength. Absorption by molecular constituents of the atmosphere (i.e. H20, CO2, N2 etc.) defines the main transmission windows (table I). Table 1: Optical transmission windows Electromagnetic Spectrum Visible and very- near Infrared Near Infrared 1.4 to 1.9 and 1.9 to 2.7 Mean Infrared 2.7 to 4.3 and 4.5 to 5.2 Far Infrared Extreme Infrared Therefore m ()can be neglected in equation (3). The aerosol absorption coefficient, a () describes the absorption of optical signals by aerosols such as fog, rain and haze. a () is given by the exact Mie theory [10] as: Where n’: the real part of the refractive index of the aerosol; Scattering cross- section for a given type of aerosol; N(r): the particle size distribution. The modified gamma distribution as an analytical function can be used to model aerosol particle distribution. It is ex- pressed as [12]: Wavelength Range (micrometer) 0.4 to 1.4 Where a, r and α are the parameters characterizing the particle size distribution. The normalized scattering coefficient is mainly dependent on the size parameter which also depends on the wave-length of the incident optical wave and radius, r of the particle. The size parameter is the ratio of the aerosol particle size to the wavelength of incident light. Therefore the resultant attenuation coefficient will be highly dependent on the incident wavelength. The Mie scattering theory pro-vides measurement of the coefficient due to scattering by particles of various sizes. However the theory is more complex because of the complexity of the aerosols’ physical properties. Some of the particles’ properties such as the refractive index and the particle computations may not be readily available. The Kruse model [13] can be employed to estimate the scattering attenuation coefficient, β a(λ). The Kruse model relates the atmospheric attenuation coefficient to the visibility of the atmosphere and the wavelength, λ. Equation (6) can be expressed as: 8 to 14 16 to 28 very accurate attenuation atmospheric Where -1 particle size distribution per unit of volume (cm); n”: imaginary part of the refractive index of the aerosol particle; r: radius of the aerosol particle; absorption cross-section for a given aerosol. The imaginary part of the index of refraction is negligible in the visible and near infrared spectral regions where most FSO systems operate. Therefore a () can also be ignored in equation (3). The sizes of molecular constituents of the air are very small compared to visible and near infrared wave- lengths. Therefore molecular scattering can also be ignored. The only dominant atmospheric factor that inhibits optical transmission is the aerosol scattering coefficient, a (). radius required for @ IJTSRD | Available Online @ www.ijtsrd.com | Volume – 2 | Issue – 6 | Sep-Oct 2018 Page: 447
International Journal of Trend in Scientific Research and Development (IJTSRD) ISSN: 2456-6470 Where th: optical threshold (2%); V[km]: the visibility of the atmosphere; o: wavelength corresponding to the maximum spectrum of the solar band (500nm); q: parameter relating to the particle size distribution of the atmosphere. The value of the q parameter indicates that the attenuation coefficient, β a ( ) depends strongly on the optical wavelength employed at all visibility ranges of the atmosphere. Fig. 3a Estimated attenuation of New Delhi: 2016 Visibility is the parameter that describes the atmosphere’s transparency. It is defined as the distance to an object at which the image contrast reduces to a certain percentage of the original contrast of the object; equivalent to a certain threshold (i.e. 2%) over the atmospheric path. IV. RESULTS AND DISCUSSIONS Based on a two-year visibility statistics (i.e. 2016 and 2017) [14] from Six major Ghanaian cities (see fig. 2 [15]), we have estimated the atmospheric attenuation using equations (8) and (9). The probability of encountering different conditions is estimated. We used two wavelengths (i.e. =1550nm and = 850nm) typically employed in commercial FSO systems in our analysis. Fig. 3b Estimated attenuation of New Delhi: 2016 atmospheric attenuation Fig. 3c Estimated attenuation of New Delhi: 2017 Fig. 2 Map of India showing the cities [15] Atmospheric Specific Attenuation Estimates The estimated optical attenuation of New Delhi, Kolkata, Chandigarh, and Chennai are shown in fig- ures 3-6. The results as depicted in figures 3-6 are further summarized in tables 2 and 3. Fig. 3d Estimated attenuation of New Delhi: 2017 @ IJTSRD | Available Online @ www.ijtsrd.com | Volume – 2 | Issue – 6 | Sep-Oct 2018 Page: 448
International Journal of Trend in Scientific Research and Development (IJTSRD) ISSN: 2456-6470 Fig. 4a estimated attenuation of Chandigarh: 2016 Fig. 5a estimated attenuation of Kolkata: 2016 Fig. 4b Estd attenuation of Chandigarh: 2016 Fig. 5b estimated attenuation of Kolkata: 2016 Fig. 4c Estd attenuation of Chandigarh: 2017 Fig. 5c estimated attenuation of Kolkata: 2017 Fig. 4d Estd attenuation of Chandigarh: 2017 Fig. 5d estimated attenuation of Kolkata: 2017 @ IJTSRD | Available Online @ www.ijtsrd.com | Volume – 2 | Issue – 6 | Sep-Oct 2018 Page: 449
International Journal of Trend in Scientific Research and Development (IJTSRD) ISSN: 2456-6470 Table 2: Specific Attenuation Estimates for Year 2016 Table 3: Specific Attenuation Estimates for Year 2017 Fig. 6a estimated attenuation of Chennai: 2016 V. In this paper, we have characterized the Indian atmospheric channel for FSO communication. The attenuation due to scattering and the probability of encountering different conditions have been investigated. From the results obtained, attenuation 150.9547dBkm-1 on 850nm 128.2316dBkm-1 on 1550nm wavelength were estimated in New Delhi, and Chennai. The highest annual average of specific attenuation was estimated in Kolkata (i.e. 1.6328dBkm-1 on 850nm wavelength and 0.9532dBkm-1 on 1550nm wavelength) with the lowest annual average estimated in Chennai (i.e. 0.7897dBkm-1 on 850nm 0.4207dBkm-1 on1550nm 850nm wavelength, annual averages of 1.5698dBkm-1 and 1.1768dBkm-1 were estimated in New Delhi and Chandigarh respectively. Using 1550nm wavelength, annual averages of 0.9494dBkm-1, and 0.6256dBkm-1 were estimated in New Delhi and Chandigarh respectively. ACKNOWLEDGEMENT We would like to thank Mr. A.N. Tuati, Mr. O. Addo, Mr. A. Amos, and Mrs. M. Amuzu all of Ghana Meteorological Agency. CONCLUSION 6b estimated attenuation of Chennai: 2016 atmospheric attenuation values as high as wavelength and 6c estimated attenuation of Chennai: 2017 wavelength wavelength). and Using 6d estimated attenuation of Chennai: 2017 @ IJTSRD | Available Online @ www.ijtsrd.com | Volume – 2 | Issue – 6 | Sep-Oct 2018 Page: 450
International Journal of Trend in Scientific Research and Development (IJTSRD) ISSN: 2456-6470 8.E. Korevaar, I. I. Kim and B. McArthur, “Atmospheric Propagation Characteristics of Highest Importance to Commercial Free Space Optics.” MRV Communications, 10343 Roselle St. San Diego, CA 921921. 9.H. Henniger, O. Wilfert, “Introduction to Free Space Optical communications” engineering, vol. 19 Jun. 2010 pp. 203 10.Recommendation ITU-R P.1817-1, “Prediction methods required for the Design of Terrestrial Free-Space Optical Links”, Question ITU-R 228/3, 2007. 11.C. F. Bohren and D. R. Huffman, "Absorption and scattering of light by small particles," J. Wiley and sons, New York, 1983 12.H. Weichel, "Laser beam propagation in the atmosphere, "Bellingham: Engineering, vol.TT3, pp. 25-39, 1990 13.Generation, transmission and detection" J. Wiley and Sons, 1962. 14.Ghana Meteorological Agency, “Years 2010 and 2011 Visibility measurements of Kumasi, Accra, Bole, Kete- Krachi, Wa and Navrongo”, 2013. 15.John Powel, Political Map of Ghana. Internet: http://www.ghanabooksjwp.com/apps/photos/phot o?photoid=165307642, Sep 13, 2012 [Jun 2013]. REFERENCES 1.D. Kedar and S. Arnon, “Urban optical wireless communication networks: the main challenges and possible solutions,” Magazine, vol. 42, no. 5, pp.S2–S7, May 2004. 2.L.C. Andrews, R.L. Phillips, C.Y. Hopen, “Laser Beam Scintillation with Applications” SPIE Press, Washington, 2001. 3.F. Liu, U. Vishkin, and S. Milner, “Bootstrapping free- space optical networks,” IEEE J. Sel. Areas Commun, vol. 24, no. 12, pp. 13–22, Dec. 2006. 4.W. O. Popoola, “Subcarrier intensity modulated Free Space Optical Communication Systems.” PhD dissertation, IEEE Communications Radio University of Northumbria, Newcastle, 2009 5.Z. Bielecki, B. Kolosowski, J. Mikolajczyk, “Free Space Optical Data Link using quantum cascade laser” 6.NADEEM, F., LEITGEB, E. Dense maritime fog attenuation prediction from measured visibility data. Radio engineering, 2010, vol. 19, no. 2, p. 223-227. 7.E. Wainright, H. H. Refai and J. J. Sluss Jr “Wavelength Diversity in Free-Space Optics to Alleviate Fog Effects” Communication Technologies, SPIE proceedings Vol. 5712 SPIE Optical Free-Space Laser @ IJTSRD | Available Online @ www.ijtsrd.com | Volume – 2 | Issue – 6 | Sep-Oct 2018 Page: 451