Download
1 / 5
50 likes | 67 Views
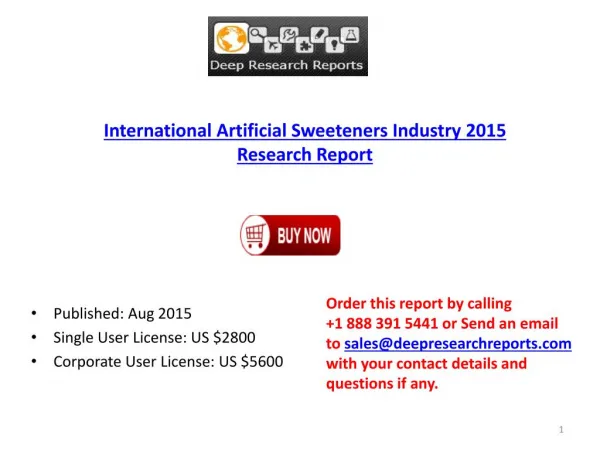
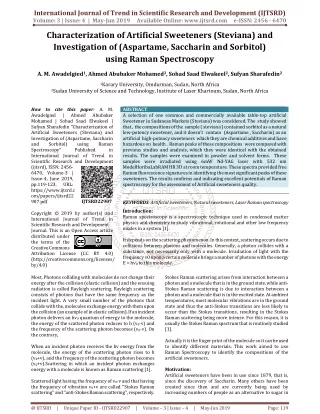
A selection of one common and commercially available table top artificial Sweetener in Sudanese Markets Steviana was considered. The study showed that , the compositions of the sample steviana contained sorbitol as a natural low potency sweetener, and it doesn't contain Aspartame , Saccharin as an artificial high potency sweeteners which they are chemical additives and have hazardous on health . Raman peaks of these compositions were compared with previous studies and analysis, which they were identical with the obtained results. The samples were examined in powder and solvent forms. These samples were irradiated using 6mW Nd YAG laser with 532 nm ModelHoribaLabRAM HR 3D at room temperature. These spectra provided free Raman fluorescence signatures in identifying the most significant peaks of these sweeteners. The results confirms and indicating excellent potentials of Raman spectroscopy for the assessment of Artificial sweeteners quality. A. M. Awadelgied | Ahmed Abubaker Mohamed | Sohad Saad Elwakeel | Sufyan Sharafedin "Characterization of Artificial Sweeteners (Steviana) and Investigation of (Aspartame, Saccharin and Sorbitol) using Raman Spectroscopy" Published in International Journal of Trend in Scientific Research and Development (ijtsrd), ISSN: 2456-6470, Volume-3 | Issue-4 , June 2019, URL: https://www.ijtsrd.com/papers/ijtsrd22907.pdf Paper URL: https://www.ijtsrd.com/physics/molecular-physics/22907/characterization-of-artificial-sweeteners-steviana-and-investigation-of-aspartame-saccharin-and-sorbitol-using-raman-spectroscopy/a-m-awadelgied<br>

E N D
International Journal of Trend in Scientific Research and Development (IJTSRD) Volume: 3 | Issue: 4 | May-Jun 2019 Available Online: www.ijtsrd.com e-ISSN: 2456 - 6470 Characterization of Artificial Sweeteners (Steviana) and Investigation of (Aspartame, Saccharin and Sorbitol) using Raman Spectroscopy A. M. Awadelgied1, Ahmed Abubaker Mohamed2, Sohad Saad Elwakeel2, Sufyan Sharafedin2 1Karary University, Omdurman, Sudan, North Africa 2Sudan University of Science and Technology,Institute of Laser Khartoum, Sudan, North Africa How to cite this paper: A. M. Awadelgied | Ahmed Mohamed | Sohad Saad Elwakeel | Sufyan Sharafedin "Characterization of Artificial Sweeteners (Steviana) and Investigation of (Aspartame, Saccharin and Sorbitol) Spectroscopy" International Journal of Trend in Scientific Research and Development (ijtsrd), ISSN: 2456- 6470, Volume-3 | Issue-4, June 2019, pp.119-123, URL: https://www.ijtsrd.c om/papers/ijtsrd22 907.pdf Copyright © 2019 by author(s) and International Journal of Trend in Scientific Research and Development Journal. This is an Open Access article distributed under the terms of the Creative Commons Attribution License (CC BY 4.0) (http://creativecommons.org/licenses/ by/4.0) Most, Photons colliding with molecules do not change their energy after the collision (elastic collision) and the ensuing radiation is called Rayleigh scattering. Rayleigh scattering consists of photons that have the same frequency as the incident light. A very small number of the photons that collide with the, molecules exchange energy with them upon the collision (an example of in elastic collision). If an incident photon delivers an hv0 quantum of energy to the molecule, the energy of the scattered photon reduces to h (v0-v) and the frequency of the scattering photon becomes (v0-v). On the contrary, When an incident photon receives the hv energy from the molecule, the energy of the scattering photon rises to h (v0+v), and the frequency of the scattering photon becomes (v0+v).Scattering in which an incident photon exchanges energy with a molecule is known as Raman scattering [1]. Scattered light having the frequency of v0-v and that having the frequency of vibration v0+v are called ‘‘Stokes Raman scattering’’ and ‘‘anti-Stokes Raman scattering’’, respectively. ABSTRACT A selection of one common and commercially available table-top artificial Sweetener in Sudanese Markets (Steviana) was considered. The study showed that , the compositions of the sample ( steviana ) contained sorbitol as a natural low-potency sweetener, and it doesn’t contain (Aspartame , Saccharin) as an artificial high-potency sweeteners which they are chemical additives and have hazardous on health . Raman peaks of these compositions were compared with previous studies and analysis, which they were identical with the obtained results. The samples were examined in powder and solvent forms. These samples were irradiated using 6mW Nd-YAG laser with 532 nm ModelHoribaLabRAM HR 3D at room temperature. These spectra provided free Raman fluorescence signatures in identifying the most significant peaks of these sweeteners. The results confirms and indicating excellent potentials of Raman spectroscopy for the assessment of Artificial sweeteners quality. KEYWORDS: Artificial sweeteners, Natural sweeteners, Laser Raman spectroscopy Introduction: Raman spectroscopy is a spectroscopic technique used in condensed matter physics and chemistry to study vibrational, rotational and other low frequency modes in a system [1]. It depends on the scattering phenomenon. In this context, scattering occurs due to collisions between photons and molecules. Generally, a photon collides with a substance, not necessarily only with a molecule. Irradiation of light with the frequency v0 upon a certain molecule brings a number of photons with the energy E = hv0 to this molecule. Stokes Raman scattering arises from interaction between a photon and a molecule that is in the ground state, while anti- Stokes Raman scattering is due to interaction between a photon and a molecule that is in the excited state. At ambient temperatures, most molecular vibrations are in the ground state and thus the anti-Stokes transitions are less likely to occur than the Stokes transitions, resulting in the Stokes Raman scattering being more intense. For this reason, it is usually the Stokes Raman spectrum that is routinely studied [1]. Actually it is the finger print of the molecule so it can be used to identify different materials. This work aimed to use Raman Spectroscopy to identify the compositions of the artificial sweeteners. Motivation: Artificial sweeteners have been in use since 1879, that is, since the discovery of Saccharin. Many others have been created since then and are currently being used by increasing numbers of people as an alternative to sugar in Abubaker using Published Raman in IJTSRD22907 @ IJTSRD | Unique Paper ID - IJTSRD22907 | Volume – 3 | Issue – 4 | May-Jun 2019 Page: 119
International Journal of Trend in Scientific Research and Development (IJTSRD) @ www.ijtsrd.com eISSN: 2456-6470 food and drink. These Sugar substitutes have a sweetening capacity that is hundreds of times greater than that of sugar while providing a pleasant sweet taste. Their very low energy content, such as few kcal per gram, can be regarded as negligible and makes them particularly suitable for weight maintenance or reduction as well as for other dietary needs. They also help in preventing dental decay, since they do not promote the growth of bacteria that cause cavities. The confectionery section of the food industry frequently needs to identify the type of artificial sweetener in a mixture prior to the introduction of the latter into the production chain. Several analytical methods based on different techniques are available for determining artificial sweeteners both qualitatively and quantitatively [2]. Classification of Sweeteners: Artificial sweeteners have been classified as nutritive and non-nutritive depending on whether they are a source of calories. The nutritive monosaccharide polyols (e.g., sorbitol, Mannitol, and xylitol) and the disaccharide Polyols (e.g., Maltitol and lactitol). They are approximately equivalent to sucrose in sweetness . The non-nutritive sweeteners, better known as artificial sweeteners, include substances from several different chemical classes that interact with taste receptors and typically exceed the sweetness of sucrose by a factor of 30– 13,000 times. Nutritive sweeteners (e.g., sucrose, fructose and sorbitol ) are generally recognized as safe (GRAS) by the Food and Drug Administration (FDA), yet concern exist about increasing sweetener intakes relative to optimal nutrition and health [2]. Health Aspects of Sweeteners: Both nutritive and non-nutritive sweeteners have generated health concerns among health care providers and the public for many years. Concerns related to safety of non-nutritive sweeteners are addressed primarily in animal studies. Artificial sweeteners are present in many food consumed by whole world. Their use is beneficial in that they provide sweetness, increasing the palatability of food without the added sugar and resulting calories, an important adjunct to weight loss and diet regimens. Most artificial sweeteners are not metabolized by the body and are therefore considered safe. However, scientists disagree about safety because the Results & Discussion: metabolites of the “no metabolized” compounds have been shown to produce deleterious effects in mice, rats, and dogs. [3][4]. Material &Method: Two samples of commercial sweeteners (steviana ) ,were Investigated in this work by laser Raman spectrometer in the Range from 50 cm-1 to 4000 cm-1for both powders and solutions. Equipment: In this work laser Confocal Raman Microscope spectrometer shown in the Figure (1) was used. The light source of this spectrometer is Nd-YAG laser with wavelength of 532 and output power of 6mW. The Raman shift in wave Number and the change in intensities in of the scattered light were compared with data in the references and previous studies. sweeteners include the Fig (1) schematic diagram of laser Raman microscope spectrometer. Samples preparation: Samples were prepared as follows: Sample: A.(steviana) powder . B.5g of (steviana) powder dissolved in a boiling mineral water (25mL) 100C0with HCl acid 5mL (PH 3.1). Fig (2) Raman spectrum of steviana powder in the range from 50 to 1700 cm-1 Figure (2) illustrates Raman spectrum of the powder sample ( steviana) in the range from 50 to 1700 cm-1. Table (1) lists the main frequencies of the Raman spectra and the vibrational assignments. @ IJTSRD | Unique Paper ID - IJTSRD22907 | Volume – 3 | Issue – 4 | May-Jun 2019 Page: 120
International Journal of Trend in Scientific Research and Development (IJTSRD) @ www.ijtsrd.com eISSN: 2456-6470 Table 1The analyzed data of Raman spectrum of (steviana )from 50 to 1700cm-1 Raman Shift (cm1) Intensity (au) 67 20.5 140.0 9.4 263.0 12.1 342.0 13.6 416.3 25.6 500.0 42.7 640.0 20.7 773.0 14.3 876.0 176 940.0 25.7 1019 20.3 1056.0 52 1093.0 36.7 1134.4 33.8 C–O and C–C stretching, and O–H bending NH2 twisting 1250.0 60.5 1325.0 42.2 1361.0 36.9 1411.5 21.4 1446 20 1632 3.4 Peak No 1 2 3 4 5 6 7 8 9 10 11 12 13 14 15 16 17 18 19 20 Assignment Skeldef υ(O–Ag–O) sorbitol C–O–C sorbitol O–H bending disulphide bridges Skeletal 5-ring deformation twist CH3 Ring Stretching Skeletal vibration and C–H twisting C–C stretch of peptide backbone C–NH2 stretching C–O stretching and O–H bending C–C stretching and O–H bending Reference [6] [6] [5][7] [5][7] [5][7] [8][7] [8] [7] [10][11] [5][7] [5][7] [13] [5][7] [5][7] [5][13][7] [14][7] [13][7] [8][7] [15][16] [8][12][7] [13] Amide III CH2 wagging tryptophan amino acid CH2 , CH3 CH2 bending C−H –CH3 Asymmetric NH2 deformation Fig (3) Raman spectrum of steviana powder in the range from 2700 to 3500 cm-1. Figure (3) illustrates Raman spectrum of the sample ( steviana) in the range from 50 to 1700cm-1.Table (2) lists the main frequencies of the Raman spectra and the vibrational assignments. Table 2 The analyzed data of Raman spectrum of (steviana ) from 2700 to 3500cm-1 Peak No Raman Shift (cm-1)Intensity (au) 21 2740.5 10.9 22 2918.2 207.0 23 2955.7 117.9 24 2975.1 65.5 25 3202 32 26 3406 26.5 Assignment -- ν CH Stretching (C6H2,C5H) ν CH Stretching (CH3) N-H or O-H Reference -- [8] [8][6] [8] [6] [17] Fig (4) Raman spectrum of steviana powder dissolved in boiling mineral water and HCL acid (PH3.1) in the range from 500 to 2500 cm-1. @ IJTSRD | Unique Paper ID - IJTSRD22907 | Volume – 3 | Issue – 4 | May-Jun 2019 Page: 121
International Journal of Trend in Scientific Research and Development (IJTSRD) @ www.ijtsrd.com eISSN: 2456-6470 Figure (4) illustrates Raman spectrum of the dissolved sample ( steviana) in the range from 500 to 2500 cm-1. Table (3) lists the main frequencies of the Raman spectra and the vibrational assignments. Table 3 The analyzed data of Raman spectrum of the dissolved (steviana ) from 500 to 2500cm-1 Peak No Raman Shift (cm-1) Intensity (au) 27 540.0 1.7 28 620 3.7 29 773.0 1.8 30 876 6.4 31 1040 11 C–C and C–O stretching and O–H bending 32 1117 13.2 33 1298.4 11.6 34 1382 14.2 35 1506.0 13.6 36 1632 19 37 1749 13 38 1885 12 39 1994 12 40 2121.0 11.8 41 2254.0 11 42 2433 10 Through the analysis of the two samples it was found that some of the vibration modes of the Steviana sweeteners appeared as Follows: 1.vibration modes of (steviana powder) at ( 263.0, 342.0, 416.0, 599.0, 640.0, 773.0 , 642.0 , 1446 , 876.0 very strong, 940.0 , 1056.0 , 1093.0 , 1134.4 , 1250.0, 1325.0) cm-1 , which were attributed to the sorbitol (C6H14O6) . 2.Vibrational modes at (622.4, 818.0) cm-1 which are attributed to Aspartame (C14H18N2O3) are not exist. Vibrational modes at (711.0, 1032, 1154.0, 1300.0) cm-1, which are attributed to Saccharin (C7H4NNaO3S) are not exist. 3.Vibrational mode at (1117 cm-1) which is attributed Magnesium carbonate. Conclusion: The results presented in this work show that Raman spectroscopy technique is an efficient method to identify the compositions of the artificial sweeteners. It provides precise information about components found in the tow samples of the commercial sweeteners. Acknowledgements: The authors would like to thank the Institute of Laser university of Sudan and the Indian Institute of Science (iisc) Bangalore INDIA for supporting this research and for technical facilitate in recording the Raman spectra . REFERENCE [1]John R. Ferro, Kauzo Nakamo to and chris W Brown, (2006)'' Introductory Raman Spectroscopy'' Fourth edition Elsevier. Assignment disulphide bridges - twist CH3 Skeletal vibration and C–H twisting Reference [9] - [10][7] [7][5] [5][7] [7] [5] [13] [13] [18] [9][12] - - [18] [16] - Magnesium carbonate C–N stretching and C–H bending V (COO)-- Amide II Asymmetric NH2 deformation C = O stretching N–H bending - - sothiocyanat Diazoniu - [7]Marleen de Veij,a Peter Vandenabeele, etal ,(2008), Reference database pharmaceutical excipients, Spectroscopy. of Raman journal spectra of of Raman [8]P. Ramesh, S. Gunasekaran,(2018), Structural, Spectroscopic Investigation and Quantum Chemical Calculation studies on Methyl L-α aspartyl – Lphenylalaninate (Aspartame) for pharmaceutical Application, International Journal of ChemTech Research. [9]Ismail HakkiBoyaci, abHavvaT¨umayTemiz, etal (2015), Dispersive and FT-Raman spectroscopic methods in food analysis, Royal society of chemistry. [10]G. Mahalakshmi1, R. Suganya2, etal, (2016), Determination of Structural Spectroscopic Properties of 4-Amino-2, 2, 6, 6- tetramethylpiperidine using FT-IR and FT-Raman Experimental Techniques and Quantum Chemical Calculations, International Journal of Science and Research (IJSR). and Vibrational [2]Dills WL, (1989) Sugar alcohols as bulk sweeteners. Annu Rev Nutr 9:161–186. [3]Bray GA1, Nielsen SJ, Popkin BM,(2004),Consumption of high-fructose corn syrup in beverages may play a role in the epidemic of obesity, Am J ClinNutr. [11]Anna G. Mignani a, Leonardo Ciaccheri, etal ,(1014), Raman spectroscopy composition of table-top artificial sweeteners, ELSEVIR. [4]Christina R. Whitehouse, BSN,etal,(2008), The Potential Toxicity of Artificial Sweeteners, Continuing education. for distinguishing the [5]Arpita Das and RunuChakraborty, An, (2016). Introduction to Sweeteners, Kolkata, India. [12]Vaclav Magnetically Assisted Surface-Enhanced Raman Scattering Selective Determination of Dopamine in an Artificial Cerebrospinal Fluid and a Mouse Striatum Using Fe3O4/Ag Nanocomposite, American Chemical Society. Ranc, ZdenkaMarkova, etal, ( 2014), [6]NiculinaPeica, characterization of the E951 artificial food sweetener by vibrational spectroscopy and theoretical modelling, Journal of Raman Spectroscopy. (2009), Identification and [13]Yuan Xiaojuan, GuHuaimin *, Wu Jiwei,(2010), Surface- enhanced Raman spectrum of Gly-Gly adsorbed on the @ IJTSRD | Unique Paper ID - IJTSRD22907 | Volume – 3 | Issue – 4 | May-Jun 2019 Page: 122
International Journal of Trend in Scientific Research and Development (IJTSRD) @ www.ijtsrd.com eISSN: 2456-6470 [16]Ewen S., Geoffery D., (2005), Modern Raman Spectroscopy, John Wiely and Sons, Ltd. ISBN 0-471- 49668-5. silver colloidal surface, Journal of Molecular Structure, ELSEVIR. [14]Evelin Witkowska1 & DorotaKorsak, etal, (2016), Surface-enhanced Raman spectroscopy introduced into the International Standard Organization (ISO) regulations as an alternative method for detection and identification of pathogens in the food industry, DOI 10.1007/s00216-016-0090-z, Anal Bioanal Chem. [17]Susanne Brunsgaard Hansen,(2000), The Application of Raman Spectroscopy for Analysis of Multi-Component Systems, Hvalsø, Denmark. [18]Nafie A. Almuslet1 and Mohammed A. Yousif,(2016), Identification Of Groundwater Components In Western Part Of Saudi Arabia Using Raman Spectroscopy, Journal of Multidisciplinary Engineering Science and Technology (JMEST). [15]Robert M., Francis X., David J., (2005), Spectromtric Idendification of Organic Compounds, seven edition, John Wiley &Sons. Inc, ISBN 0-471-39362-2,USA. @ IJTSRD | Unique Paper ID - IJTSRD22907 | Volume – 3 | Issue – 4 | May-Jun 2019 Page: 123