Download
1 / 11
110 likes | 113 Views
The effectiveness of low cost biosorbent immobilized Sugarcane bagasse Saccharum officinarum L. onto alginate Polvinyl glutaraldehyde, was studied for Lead II biosorption from aqueous solutions in a batch system. The FTIR study of acid treated biosorbent showed that the possibility of availability of function groups such as hydroxyl, carbonyl, carboxylic etc. The SEM represents a porous structure with large surface area.XRD used for phase identification of a crystalline material The effects of operational factors including solution pH, biosorbent dose, initial chromium VI concentration, contact time and temperature were studied. The equilibrium isotherm data were comparing by using the Langmuir, Freundlich, DKR and Temkin adsorption isotherm models in which Langmuir isotherm was found to be fitted best. The Kinetics of sorption of Lead II were described by a pseudo First order kinetic, pseudo kinetic, Elovich and Weber and Morris intra diffusion model in which pseudo second order model was found to be fitted best. Thermodynamic studies were also carried out. The results showed that immobilized sugarcane baggase Saccharum officinarum L. alginate Polvinyl glutaraldehyde beads was a low cost capable sorbent to seize Lead II from wastewater. Anukthi C Poojari | Satish A. Bhalerao "Biosorption studies of lead (II) from aqueous solution by immobilized Sugarcane bagasse (Saccharum officinarum L.) onto alginate Polvinyl glutaraldehyde" Published in International Journal of Trend in Scientific Research and Development (ijtsrd), ISSN: 2456-6470, Volume-3 | Issue-2 , February 2019, URL: https://www.ijtsrd.com/papers/ijtsrd21554.pdf Paper URL: https://www.ijtsrd.com/biological-science/botany/21554/biosorption-studies-of--lead-ii-from-aqueous-solution-by--immobilized-sugarcane-bagasse-saccharum-officinarum-l-onto-alginate-polvinyl-glutaraldehyde/anukthi-c-poojari<br>

E N D
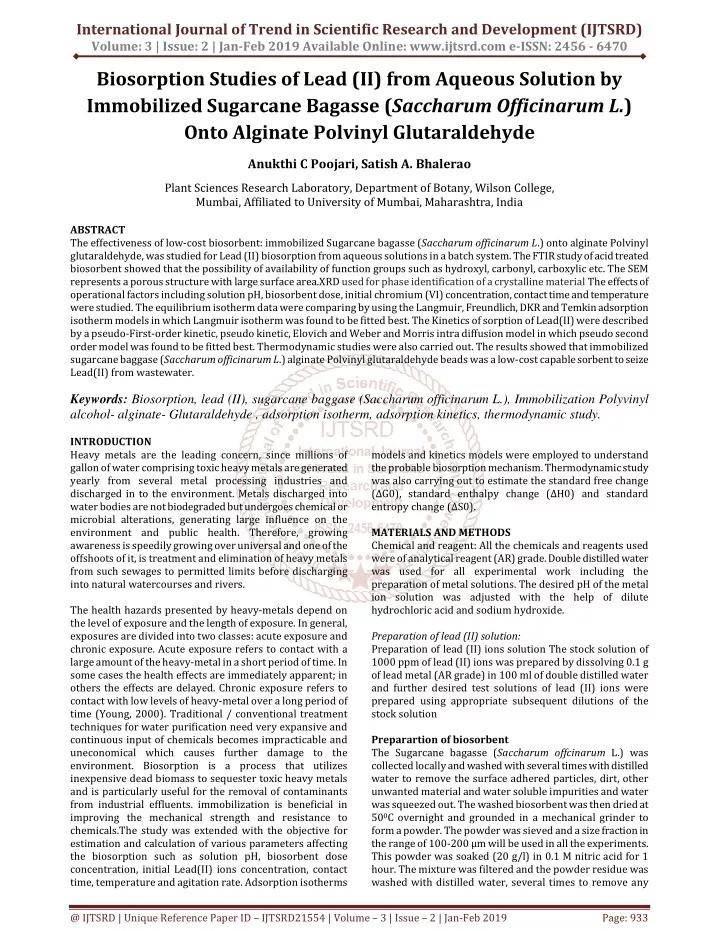
International Journal of Trend in Scientific Research and Development (IJTSRD) Volume: 3 | Issue: 2 | Jan-Feb 2019 Available Online: www.ijtsrd.com e-ISSN: 2456 - 6470 Biosorption Studies of Lead (II) from Aqueous Solution by Immobilized Sugarcane Bagasse (Saccharum Officinarum L.) Onto Alginate Polvinyl Glutaraldehyde Anukthi C Poojari, Satish A. Bhalerao Plant Sciences Research Laboratory, Department of Botany, Wilson College, Mumbai, Affiliated to University of Mumbai, Maharashtra, India ABSTRACT The effectiveness of low-cost biosorbent: immobilized Sugarcane bagasse (Saccharum officinarum L.) onto alginate Polvinyl glutaraldehyde, was studied for Lead (II) biosorption from aqueous solutions in a batch system. The FTIR study of acid treated biosorbent showed that the possibility of availability of function groups such as hydroxyl, carbonyl, carboxylic etc. The SEM represents a porous structure with large surface area.XRD used for phase identification of a crystalline material The effects of operational factors including solution pH, biosorbent dose, initial chromium (VI) concentration, contact time and temperature were studied. The equilibrium isotherm data were comparing by using the Langmuir, Freundlich, DKR and Temkin adsorption isotherm models in which Langmuir isotherm was found to be fitted best. The Kinetics of sorption of Lead(II) were described by a pseudo-First-order kinetic, pseudo kinetic, Elovich and Weber and Morris intra diffusion model in which pseudo second order model was found to be fitted best. Thermodynamic studies were also carried out. The results showed that immobilized sugarcane baggase (Saccharum officinarum L.) alginate Polvinyl glutaraldehyde beads was a low-cost capable sorbent to seize Lead(II) from wastewater. Keywords: Biosorption, lead (II), sugarcane baggase (Saccharum officinarum L.), Immobilization Polyvinyl alcohol- alginate- Glutaraldehyde , adsorption isotherm, adsorption kinetics, thermodynamic study. INTRODUCTION Heavy metals are the leading concern, since millions of gallon of water comprising toxic heavy metals are generated yearly from several metal processing industries and discharged in to the environment. Metals discharged into water bodies are not biodegraded but undergoes chemical or microbial alterations, generating large influence on the environment and public health. Therefore, growing awareness is speedily growing over universal and one of the offshoots of it, is treatment and elimination of heavy metals from such sewages to permitted limits before discharging into natural watercourses and rivers. The health hazards presented by heavy-metals depend on the level of exposure and the length of exposure. In general, exposures are divided into two classes: acute exposure and chronic exposure. Acute exposure refers to contact with a large amount of the heavy-metal in a short period of time. In some cases the health effects are immediately apparent; in others the effects are delayed. Chronic exposure refers to contact with low levels of heavy-metal over a long period of time (Young, 2000). Traditional / conventional treatment techniques for water purification need very expansive and continuous input of chemicals becomes impracticable and uneconomical which causes further damage to the environment. Biosorption is a process that utilizes inexpensive dead biomass to sequester toxic heavy metals and is particularly useful for the removal of contaminants from industrial effluents. immobilization is beneficial in improving the mechanical strength and resistance to chemicals.The study was extended with the objective for estimation and calculation of various parameters affecting the biosorption such as solution pH, biosorbent dose concentration, initial Lead(II) ions concentration, contact time, temperature and agitation rate. Adsorption isotherms models and kinetics models were employed to understand the probable biosorption mechanism. Thermodynamic study was also carrying out to estimate the standard free change (ΔG0), standard enthalpy change (ΔH0) and standard entropy change (ΔS0). MATERIALS AND METHODS Chemical and reagent: All the chemicals and reagents used were of analytical reagent (AR) grade. Double distilled water was used for all experimental work including the preparation of metal solutions. The desired pH of the metal ion solution was adjusted with the help of dilute hydrochloric acid and sodium hydroxide. Preparation of lead (II) solution: Preparation of lead (II) ions solution The stock solution of 1000 ppm of lead (II) ions was prepared by dissolving 0.1 g of lead metal (AR grade) in 100 ml of double distilled water and further desired test solutions of lead (II) ions were prepared using appropriate subsequent dilutions of the stock solution Preparartion of biosorbent The Sugarcane bagasse (Saccharum offcinarum L.)was collected locally and washed with several times with distilled water to remove the surface adhered particles, dirt, other unwanted material and water soluble impurities and water was squeezed out. The washed biosorbent was then dried at 500C overnight and grounded in a mechanical grinder to form a powder. The powder was sieved and a size fraction in the range of 100-200 µm will be used in all the experiments. This powder was soaked (20 g/l) in 0.1 M nitric acid for 1 hour. The mixture was filtered and the powder residue was washed with distilled water, several times to remove any @ IJTSRD | Unique Reference Paper ID – IJTSRD21554 | Volume – 3 | Issue – 2 | Jan-Feb 2019 Page: 933
International Journal of Trend in Scientific Research and Development (IJTSRD) @ www.ijtsrd.com eISSN: 2456-6470 acid contents. This filtered biomass was first dried at room temperature and then dried in an oven at 105ºC for 1-2 hrs. For further use, the dried biomass was stored in air tighten plastic bottle to protect it from moisture. Immobilization of the biosorbent: 2g of Glutaraldehyde was take in a beaker with 50ml of water and melted it ,if required added a little water more till it melted completely. 2.0 g anhydrous calcium chloride in 100ml distilled water was made. In another beaker add Glutaraldehyde, 10ml of Polyvinyl alcohol, 0.5g of powdered sugarcane bagasseand finally added calcium alginate solution and mixed it well This mixture was extruded as droplet in 2% solution of calcium chloride through a glass nozzle (1.0 cm length and 2.5-3mm internal diameter) and the solution was stirred to avoid clumping of immobilized beads. Beads were formed of approximately 3-3.5mm diameter. The beads were allow curing for 1 hour at 4oC in the same solution and then washed thoroughly with distilled water. After that it was stored in refrigerator for further use as biosorbent. Instrumentation: The pH of the solution was measured by digital pH meter (EQUIP-TRONICS, model no. Eq-610) using a combined glass electrode. The concentration of Lead(II) in the solutions before and after equilibrium was determined by using Inductively Coupled Plasma-Atomic Emission Spectroscopy (ICP-AES) technique. Biosorbent was characterized by Fourier Transform Infrared (FTIR), Scanning Electron Microscope (SEM) and X-ray diffraction (XRD). Characterization of biosorbent by Fourier Transform Infrared (FTIR) analysis: The Fourier Transform Infrared (FTIR) spectroscopy was used to identify the functional groups present in the biosorbent. The biomass samples were examined using FTIR spectrometer (model:FT/IR-4100typeA) within range of 400-4000 cm-1. All analysis was performed using KBr as back ground material. In order to form pellets, 0.02 g of biomass was mixed with 0.3 g KBr and pressed by applying pressure. Characterization of biosorbent by Scanning Electron Microscope (SEM) analysis: The Scanning Electron Microscope (SEM) was used to see the porosity of the biosorbent. The samples were covered with a thin layer of gold and an electron acceleration voltage of 10 KV was applied and then Scanning Electron Micrograph was recorded. Characterization of biosorbent by X-ray diffraction (XRD) analysis: X-ray diffraction (XRD) was used for the qualitative and quantitative determination of solid samples of biosorbent. It works on the principle that X-ray diffraction pattern is unique for each sample. This pattern from XRD was compared with a known compound and the chemical compound was identified. Experimental procedure: The static (batch) method was employed at temperature (300C) to examine the biosorption of Lead (II) by biosorbent. The method was used to determine the adsorption capacity, stability of biosorbent and optimum biosorption conditions. The parameters were studied by combining biosorbent with Lead(II) solution in 250 ml separate reagent bottles. The reagent bottles were placed on a shaker with a constant speed and left to equilibrate. The samples were collected at predefined time intervals, centrifuged, the content was separated from the adsorbent by filtration, using Whatmann filter paper and amount supernatant/filtrate solutions was determined by ICPAES. The following equation was used to compute the percent removal (% Adsorption) of Lead(II) by the adsorbent, of Lead (II) in the where Ci and Ce are the initial concentrations and equilibrium concentrations of the Lead(II) in mg/L. The equilibrium adsorptive quantity (qe) was determined by the following equation, × V where qe (mg metal per g dry biosorbent) is the amount of Lead(II) biosorbed, V (in liter) is the solution volume and w (in gram) is the amount of dry biosorbent used. Desorption Study: To evaluate desorption efficiency, Lead(II) loaded biosorbent was dried after experiments. The dried biosorbent was contacted with 0.1 M nitric acid (HNO3), 0.1 M hydrochloric acid (HCl) and 0.1M sulphuric acid (H2SO4) separately for 3 hours to allow Lead(II) to be release from biosorbent. The samples were separated from the biosorbents by filtration, using Whitman filter paper and amount supernatant/filtrate solutions was determined by ICPAES to find out desorption efficiency. Desorption efficiency was calculated from the amount of metal adsorbed on the biosorbent and the final metal concentration in the biosorption medium. Desorption efficiency equilibrium sorption of Lead(II) in the Results and discussion Characterization of biosorbent by Fourier Transform Infrared (FTIR) analysis: The Fourier Transform Infrared (FTIR) spectroscopy was used to identify the functional groups present in the biosorbent. The biosorbent samples were examined using FTIR spectrometer (Model: FT/IR4100typeA) within range of 400-4000 cm-1. All analysis was performed using KBr as back ground material. a FTIR analysis was carried out and the spectra are shown in Fig.1. (a and b). As seen in the figure unloaded biosorbent displays a number of absorption peaks, reflecting the complex nature of biosorbent. The broad peak at 3394 cm-1 is the indicator of -OH and - NH groups. The peaks located at 1741 cm-1 are characteristics of carbonyl group. The presence of - OH group along with carbonyl group confirms the presence of carboxyl acid groups in the biosorbent. The peaks observed at 1134 cm-1 are due to C-H and C-O bonds. The –OH, NH, carbonyl and carboxyl groups are important sorption sites. As compared to simple biosorbent, biosorbent loaded with Lead(II) the broadening of -OH peak at 3394 cm-1 and carbonyl group peak at 1741 cm-1 was observed. This indicates the involvement of hydroxyl and carbonyl groups in the biosorption of Lead(II) . @ IJTSRD | Unique Reference Paper ID – IJTSRD21554 | Volume – 3 | Issue – 2 | Jan-Feb 2019 Page: 934
International Journal of Trend in Scientific Research and Development (IJTSRD) @ www.ijtsrd.com eISSN: 2456-6470 Characterization of biosorbent by Scanning Electron Microscope (SEM) analysis: SEM analysis was carried out for the biosorption of Lead(II) on the surfaces of the Polyvinyl alcohol- alginate- Glutaraldehyde immobilized Sugarcane bagasse (Saccharum offcinarum L.) The SEM images of Polyvinyl alcohol- alginate- Glutaraldehyde immobilized Sugarcane bagasse (Saccharum offcinarum L.) before and after biosorption of Lead(II) are shown in Figure 2 (a) and 2 (b) respectively. These micrographs represent a porous structure with large surface area. The SEM clearly demonstrated that there is more uniformity after biosorption of Lead(II) onto biosorbent in comparison to before biosorption. It was evident from the micrographs that the biosorbents presents an unequal structure before Lead(II) biosorbed. The number of canals in the biosorbents was higher in the initial case. The Lead(II) biosorbed on the cell wall matrix and created stronger cross linking and uniformity on the surface of biosorbent. X-ray diffraction analysis (XR-D) analysis: XRD pattern of the unloaded and loaded biosorbent with the Lead(II) solution is shown in Figure 3(a) and 3(b). The XRD spectra of unloaded Lead(II) which shows broad peaks were obtained instead of sharp peaks indicating the sample was poorly crystalline. The XRD spectra of loaded Lead(II) exhibit strong peaks at 2θ value 20.36º, 31.60º and 45.40º corresponding to 275.567, 389.259 and 189.6950, respectively for Sugarcane baggase modified with PVA- alginate-glutraaldehyde. Also, XRD pattern of Lead(II) loaded biosorbent shows the presence of phases of Cr2O7 2− and HCrO4 - which indicates that some of the Lead (II) is converted into Cr2O7 and HCrO4 - at pH 5. So it was concluded that, Lead(II) finally get adsorbed over the surface of biosorbent. Effect of pH: For Lead(II) stability pH is one of the most important parameter which controls the surface properties of biosorbents, functional groups and ionic state of metal’s species. The optimization of pH was done by varying the pH in the range of 1-8 for bisorption of Lead(II) and pH trend observed in this case is shown in Figure 4. It was found that at pH 5 the biosorption process was maximum with 94.87% and after increasing pH, biosorption was decreases. As the pH of the solution increases, charges on the surface of biosorbent becomes negative, this leads to generation of repulsive forces between Lead(II) &biosorbent and inhibits adsorption and resultantly percent Lead(II) uptake may slightly decrease. Effect of biosorbent dose concentration: Biosorbent dosage is an important parameter studied while conducting batch mode studies. The sorption capacity of Sugarcane bagasse (Saccharum offcinarum L.)onto Lead(II) by varying its dosage from 1 g/L to 15 g/L is shown in Figure 5. From the results it was found that biosorption of Lead(II) increases with increase in biosorbent dosage and is highly dependent on biosorbent concentration. Increase in biosorption by increase in biosorbent dose is because of increase of ion exchange site ability, surface areas and the number of available biosorption sites (Naiya et al., 2009). The point of saturation for Sugarcane bagasse (Saccharum offcinarum L.) was found at 5 g/L of biosorbent dose with 94.87% of removal efficiency. The decrease in efficiency at higher biosorbent concentration could be explained as a consequence of partial aggregation of adsorbent which results in a decrease in effective surface area for metal uptake (Karthikeyan et. al. 2007). Hence, biosorbent dose 5 g/L was chosen for all further studies. Effect of initial Lead(II) concentration: The effect of initial Lead(II) concentration from 5 mg/L-250 mg/L on the removal of Lead(II) from aqueous solutions at biosorbent dose concentration 5 g/L and at optimum pH 5 at 300C was studied. On increasing the initial Lead(II) concentration, the total Lead(II) ions uptake decreased slightly when Lead(II) concentration increases from 5 mg/L - 250 mg/L. Effect of contact time: In order to optimize the contact time for the maximum uptake of Lead (II) onto biosorbent, contact time was varied between 10 minutes-240 minutes on the removal of Lead(II) from aqueous solutions in the concentration of Lead(II) 10 mg/L and biosorbent dose 5 g/L at optimum pH 5.0 at 300C. The results obtained from the biosorption capacity of Lead(II) onto Sugarcane bagasse (Saccharum offcinarum L.) showed that the biosorption increases with increase in contact time until it reached equilibrium. The optimum contact time for biosorption of Lead(II) ions onto Sugarcane bagasse (Saccharum offcinarum L.)was 180 minutes with 94.21 % removal. The rapid uptake of Lead(II) is due to the availability of ample active sites for sorption. A further increase in the contact time has a negligible effect on the biosorption capacity of Lead(II) biosorption. So a contact time of 180 minute was fixed for further experiments. Effect of temperature: The effect of temperature on removal of Lead(II) from aqueous solutions using Polyvinyl alcohol- alginate- Glutaraldehyde immobilized Sugarcane bagasse (Saccharum offcinarum L.)was studied at different temperatures from 200C-400C. The influence of temperature is depicted in Figure 8. The percentage removal of Lead(II) increased from 91.42% to 94.59% in the range of temperature 20oC- 40oC respectively. It can be clearly seen from the figure that, increase in temperature the percentage removal increased slowly. The increase in biosorption capacity with the increase in temperature indicates that the biosorption process is endothermic in nature. Effect of agitation rate: The effect of agitation rate on removal of Lead(II) from aqueous solutions at biosorbent dose 10 mg/ml and at optimum pH 5 at 300C was studied at different agitation rate such as 40 rpm, 80 rpm, 120 rpm, 160 rpm and 200rpm. The efficiency was highest at 120rpm with percentage removal 94.85 %. So, 120 rpm was chosen for all further biosorption studies. Desorption study: In application of real wastewater, desorption of heavy metal ions in the biosorbent is important process. Polyvinyl alcohol- alginate- Glutaraldehyde immobilized Sugarcane bagasse (Saccharum offcinarum L.)was the most effective waste biosorbent with desorption efficiency 64.63% (0.1 M hydrochloric acid), 68.93% (0.1 M nitric acid) and 74.82% (0.1 M sulphuric acid). Sulphuric acid has shown highest desorbed capacity of Lead(II) followed by hydrochloric acid and nitric acid from Polyvinyl alcohol- alginate- Glutaraldehyde immobilized Sugarcane bagasse (Saccharum offcinarum L.) @ IJTSRD | Unique Reference Paper ID – IJTSRD21554 | Volume – 3 | Issue – 2 | Jan-Feb 2019 Page: 935
International Journal of Trend in Scientific Research and Development (IJTSRD) @ www.ijtsrd.com eISSN: 2456-6470 Adsorption isotherm models The analysis of the adsorption isotherms data by fitting them into different adsorption isotherm models is an important step to find the suitable model that can be used for design process. The experimental data were applied to the two- parameter adsorption isotherm models: Langmuir, Freundlich, DubininKaganer-Redushkevich (DKR) and Temkin.Adsorption isotherms results for biosorption of Lead(II) by Sugarcane bagasse (Saccharum offcinarum L.)is shown below; Langmuir adsorption isotherm (Langmuir, 1918): The Langmuir equation, which is valid for monolayer sorption onto a surface of finite number of identical sites, is given by; Equilibrium data for the adsorption is plotted as log q vs log Ce, as shown in Figure 10 (b). The two constants n and K are calculated from the slope (1/n) and intercept (log K) of the line, respectively. The values of K, 1/n and regression coefficient (R 2 ) are listed in Table 1. The n value indicates the degree of non-linearity between solution concentration and adsorption as follows: if n = 1, then adsorption is linear; if n < 1, then adsorption is chemical process; if n>1, then adsorption is a physical process. A relatively slight slope and a small value of 1/ n indicate that, the biosorption is good over entire range of concentration. The n value in Freundlich equation was found to be 1.1473. Since n >1, this indicates that biosorption is a physical process biosorption of Lead(II) ions onto Polyvinyl alcohol- alginate- Glutaraldehyde Sugarcane bagasse (Saccharum offcinarum L.). The higher value of K (7.4404) indicates the higher adsorption capacity for the Polyvinyl alcohol- alginate- Glutaraldehyde immobilized Sugarcane bagasse (Saccharum offcinarum L.) Dubinin-Kaganer-Radushkevich isotherm (Dubinin and Radushkevich, 1947): Linearized Dubinin-Kaganer-Radushkevich (DKR) adsorption isotherm equation is represented as; where qm is the maximum biosorption capacity of adsorbent (mg g-1). b is the Langmuir biosorption constant (L mg-1) related to the affinity between the biosorbent and biosorbate. Linearized Langmuir isotherm allows the calculation of adsorprtion capacities and Langmuir constants and is represented as: (DKR) adsorption β ε2 where qm is the maximum biosorption capacity, β is the activity coefficient related to mean biosorption energy and ε is the polanyi potential, which is calculated from the following relation; The linear plots of 1/q vs 1/ce is shown in Figure 10 (a). The two constants b and qm are calculated from the slope (1/qm·b) and intercept (1/qm) of the line. The values of qm, b and regression coefficient (R 2 ) are listed in Table 1. The essential characteristics of the Langmuir isotherm parameters can be used to predict the affinity between the biosorbate and biosorbent which is calculated using following equation; ε= ) (10) Equilibrium data for the adsorption is plotted as lnqe vs ε2 , as shown in Figure 10 (c). The two constants β and qm are calculated from the slope (β) and intercept (lnqm) of the line, respectively. The values of adsorption energy E was obtained by the following relationship, RL (4.1) where b is the Langmuir constant and Ci is the maximum initial concentration of Lead(II). The value of separation parameters RL provides important information about the nature of adsorption. The value of RL indicated the type of Langmuir isotherm separation factor or dimensionless equilibrium parameters, RL expressed as in the following equation: to be irreversible (RL = 0), favorable (0 < RL < 1), linear (RL = 1) or unfavorable (RL >1). The RL was found to 0.1169-0.8688 for concentration of 5 mg/L250 mg/L of Lead(II). They are in the range of 0-1 which indicates favorable biosorption (Malkoc and Nuhoglu 2005). Frenudlich adsorption isotherm (Frenudlich, 1939): Freundlich equation is represented by; (11) The E value was found to be 1.0000 KJ mol-1. The mean free energy gives information about biosorption mechanism whether it is physical or chemical biosorption. If E value lies between 8 KJ mol-1 and 16KJ mol-1, the biosorption process take place chemically and E > 8 KJ mol-1, the biosorption process of the physical in nature (Olivieri and Brittenham, 1997). In the present work, E value (1.5812 KJ mol-1) which is less than 8 KJ mol-1, the biosorption of Lead(II) ions onto Polyvinyl alcohol- alginate- Glutaraldehyde immobilized Sugarcane bagasse (Saccharum offcinarum L.)is of physical in nature (Sawalha et al., 2006). Temkin adsorption isotherm (Temkin and Pyzhev, 1940): Linearized Temkin adsorption isotherm is given by the equation; where K and n are empirical constants incorporating all parameters affecting the biosorption process such as, biosorption capacity and biosorption intensity respectively. Linearized Freundlich adsorption isotherm was used to evaluate the sorption data and is represented as ) (12) where bT is the Temkin constant related to heat of biosorption (J/mol) and AT is the Temkin isotherm constant (L/g). Equilibrium data for the adsorption is plotted as qe vs lnCe, as shown in Figure 10(d). The two constants bT and AT are calculated from the slope (RT/bT) and intercept (RT/bT· @ IJTSRD | Unique Reference Paper ID – IJTSRD21554 | Volume – 3 | Issue – 2 | Jan-Feb 2019 Page: 936
International Journal of Trend in Scientific Research and Development (IJTSRD) @ www.ijtsrd.com eISSN: 2456-6470 lnAT) of the line. The values of AT,bT and regression coefficient (R 2 ). The various constants and regression coefficient R 2 obtained from adsorption isotherms (Langmuir, Freundlich, Dubinin-Kaganer-Redushkevich (DKR) and Temkin) are summarized in Table 1. Adsorption kinetics: As aforementioned, a lumped analysis of adsorption rate is sufficient to practical operation from a system design point of view. The commonly employed lumped kinetic models, namely (a) the pseudo-firstorder equation (Lagergren 1898) (b) the pseudosecond-order equation (Mckay et al., 1999) (c) Elovich equation (Chien and Clayton 1980) (d) Weber & Morris intra-particle diffusion equation (Weber and Morris, 1963) are presented below; The pseudo-second-order model was plotted for t/qt against t (Figure 11 (b)). The values of qe and k2 are calculated from the slope (1/qe) and intercept (1/k2 qe 2 ) of the plot and values are shown in Table 2. Pseudo-second-order kinetic model showered the strongest correlation (R 2= 1.0000). This suggests that Lead(II) biosorption occurs in a monolayer fashion and which relies on the assumption that chemisorption or chemical adsorption is the ratelimiting step. Lead(II) reacts chemically with the specific binding sites on the surface of biosorbent. The Elovich model was plotted for qt against ln t (Figure 11 (c)). The values of β and α are calculated from the slope (1/ β) and the intercept (ln (α β)/ β) of the plot and values are shown in Table 2. The Elovich model has been used with the assumption that the actual adsorption surface is energetically heterogeneous (Thomas and Thomas, 1997). The Weber & Morris intra-particle diffusion model was plotted for qt against t 0.5 (Figure 11 (d)). The value of ki and c are calculated from the slope (ki) and intercept (c) of the plot and values are shown in Table 2. The Weber and Morris intra-particle diffusion model showed a (R 2= 0.5917) being lower than the correlation coefficient for the pseudo-second-order model. The intercept of the plot does not pass through the origin, this is indicative of some degree of boundary layer control and intra-particle pore diffusion is not only rate-limiting step (Weber and Morris, 1963). The plot of intra-particle diffusion model showed multilinearity, indicating that three steps take place. The first, sharper portion is attributed to the diffusion of adsorbate through the solution to the external surface of biosorbent or the boundary layer diffusion of solute molecules. The second portion describes ion stage, where intra-particle diffusion is a rate limiting. The third portion is attributed to the final equilibrium stage. However the intercept of the line fails to pass through the origin which may attribute to the difference in the rate of mass transfer in the initial and final stages of biosorption (Panday et al., 1986). Determination of thermodynamic The effect of temperature on removal of Lead(II) from aqueous solutions in the concentration of Lead(II) 10 mg/L and biosorbent dose concentration 5 mg/ml with optimum pH 5.0 was studied. Experiments were carried out at different temperatures from 200C-400C. The samples were allowed to attain equilibrium. Sorption slightly increases from. The equilibrium constant (Catena and Bright, 1989) at various temperatures and thermodynamic parameters of adsorption can be evaluated from the following equations; where qe (mg g-1) is the solid phase concentration at equilibrium, qt (mg g-1) is the average solid phase concentration at time t (min), k1 (min-1) and k2 (g mg-1 min-1) are the pseudo-first-order and pseudo-secondorder rate constants, respectively. The symbols of α (mg g-1 min-1) and β (g mg-1) are Elovich coefficients representing initial biosorption rate and desorption constants, respectively. ki ( mg g-1 min-1/2) is the intraparticle diffusion rate constant, c is intercept. If the adsorption follows the pseudo-first-order model, a plot of ln (qe-qt) against time t should be a straight line. Similarly, t/qt should change lineally with time t if the adsorption process obeys the pseudo-second order model. If the adsorption process obeys Elovich model, a plot of qt against ln t should be a straight line. Also a plot of qt against t 0.5 changes lineally the adsorption process obeys the Weber and Morris intraparticle diffusion model. Kinetic plots depicted in Figure 8 (a) (b) (c) and (d) (Septhum et al., 2007). Biosorption of Lead(II) onto biosorbent was monitored at different specific time interval. The Lead(II) uptake was calculated from the data obtained. From the Lead(II) uptake was plotted against time to determine a suitable kinetic model, the adsorption data was fitted into pseudo-first-order model, pseudo-second-order model, Elovich models and the Weber & Morris intra-particle diffusion model. The pseudo- first-order model was plotted for ln (qe-qt) against t (Figure 11 (a)). The values of k1 and qe values were calculated from the slope (k1) and intercept (ln qe) of the plot and shown in Table 2. Pseudo-first-order model showered the correlation value (R 2= 0.7545) being lower than the correlation coefficient for the pseudo-second-order model. Kinetic biosorption for pseudo-first-order model occurs chemically and involves valency forces through ion sharing or exchange of electron between the biosorbent and the ions adsorbed onto it (Septhum et al., 2007). @ IJTSRD | Unique Reference Paper ID – IJTSRD21554 | Volume – 3 | Issue – 2 | Jan-Feb 2019 Page: 937
International Journal of Trend in Scientific Research and Development (IJTSRD) @ www.ijtsrd.com eISSN: 2456-6470 where Kc is the equilibrium constant, Ce is the equilibrium concentration in solution (mg/L) and CAe is the amount of Lead(II) biosorbed on the biosorbent per liter of solution at equilibrium (mg/L). ∆G0 , ∆H0 and ∆S0 are changes in standard Gibbs free energy (kJ/mol), standard enthalpy (kJ/mol) and standard entropy (J/mol K), respectively. R is the gas constant (8.314 J/mol K) and T is the temperature (K). The values of ∆H0 and ∆S0 were determined from the slope and the intercept from the plot of lnKc versus 1/T (Figure 12). The values of equilibrium constant (Kc), standard Gibbs free energy change (∆G0 ), standard enthalpy change (∆H0 ) and the standard entropy change (∆S0 ) calculated in this work were presented in Table 3. The equilibrium constant (Kc) increases with increase in temperature, which may be attributed to the increase in the pore size and enhanced rate of intra-particle diffusion. The value of standard Gibbs free energy change (∆G0 ) is small and negative and indicates the spontaneous nature of the biosorption. The values of ∆G0 were found to decreases as the temperature increases, indicating more driving force and hence resulting in higher biosorption capacity. The value of ∆H0 was positive, indicating the endothermic nature of the biosorption of Lead(II) onto Polyvinyl alcohol- alginate- Glutaraldehyde immobilized Sugarcane bagasse (Saccharum offcinarum L.). The positive values of ∆S0 shows an affinity of biosorbent and the increasing randomness at the solid solution interface during the biosorption process. Figure 1: FTIR spectra of Polyvinyl alcohol- alginate- Glutaraldehyde immobilized Sugarcane bagasse (Saccharum offcinarum L.) (a) Unloaded with Lead (II) (b) Loaded with Lead (II) @ IJTSRD | Unique Reference Paper ID – IJTSRD21554 | Volume – 3 | Issue – 2 | Jan-Feb 2019 Page: 938
International Journal of Trend in Scientific Research and Development (IJTSRD) @ www.ijtsrd.com eISSN: 2456-6470 Figure 2: Scanning Electron Microscope (SEM) analysis of Polyvinyl alcohol- alginate- Glutaraldehyde immobilized Sugarcane bagasse (Saccharum offcinarum L.) (a) Unloaded with Lead (II) (b) Loaded with Lead (II) Figure 3:X-ray diffraction (XRD) analysis of Polyvinyl alcohol- alginate- Glutaraldehyde immobilized Sugarcane bagasse (Saccharum offcinarum L.) (a) Unloaded with Lead (II) (b) Loaded with Lead (II) Figure 4: Effect of pH on Lead (II) biosorption by Polyvinyl alcohol- alginate- Glutaraldehyde immobilized Sugarcane bagasse (Saccharum offcinarum L.) (biosorbent dose concentration: 5 g/L, Lead (II) concentration: 10 mg/L, contact time: 180 minutes, temperature: 300C) @ IJTSRD | Unique Reference Paper ID – IJTSRD21554 | Volume – 3 | Issue – 2 | Jan-Feb 2019 Page: 939
International Journal of Trend in Scientific Research and Development (IJTSRD) @ www.ijtsrd.com eISSN: 2456-6470 figure 5: Effect of biosorbent dose concentration on Lead (II) biosorption by Polyvinyl alcohol- alginate- Glutaraldehyde immobilized Sugarcane bagasse (Saccharum offcinarum L.) (biosorbent dose concentration: 5 g/L, Lead (II) concentration: 10 mg/L, contact time: 180 minutes, temperature: 300C) Figure 6: Effect of lead (II) concentration on Lead (II) biosorption by Polyvinyl alcohol- alginate- Glutaraldehyde immobilized Sugarcane bagasse (Saccharum offcinarum L.) (biosorbent dose concentration: 5 g/L, Lead (II) concentration: 10 mg/L, contact time: 180 minutes, temperature: 300C) Figure 7: Effect of contact time on Lead (II) biosorption by Polyvinyl alcohol- alginate- Glutaraldehyde immobilized Sugarcane bagasse (Saccharum offcinarum L.) (biosorbent dose concentration: 5 g/L, Lead (II) concentration: 10 mg/L, contact time: 180 minutes, temperature: 300C) Figure 8: Effect of temperature on Lead (II) biosorption by Polyvinyl alcohol- alginate- Glutaraldehyde immobilized Sugarcane bagasse (Saccharum offcinarum L.) (biosorbent dose concentration: 5 g/L, Lead (II) concentration: 10 mg/L, contact time: 180 minutes, temperature: 300C) @ IJTSRD | Unique Reference Paper ID – IJTSRD21554 | Volume – 3 | Issue – 2 | Jan-Feb 2019 Page: 940
International Journal of Trend in Scientific Research and Development (IJTSRD) @ www.ijtsrd.com eISSN: 2456-6470 Figure 9: Effect of agitation rate on on Lead (II) biosorption by Polyvinyl alcohol- alginate- Glutaraldehyde immobilized Sugarcane bagasse (Saccharum offcinarum L.) (biosorbent dose concentration: 5 g/L, Lead (II) concentration: 10 mg/L, contact time: 180 minutes, temperature: 300C) Figure 10: Adsorption isotherms (a) Langmuir, (b) Freundlich (c) DKR and (d) Temkin for Lead (II) biosorption by Polyvinyl alcohol- alginate- Glutaraldehyde immobilized Sugarcane bagasse (Saccharum offcinarum L.) (biosorbent dose concentration: 5 g/L, Lead (II) concentration: 10 mg/L, contact time: 180 minutes, temperature: 300C) @ IJTSRD | Unique Reference Paper ID – IJTSRD21554 | Volume – 3 | Issue – 2 | Jan-Feb 2019 Page: 941
International Journal of Trend in Scientific Research and Development (IJTSRD) @ www.ijtsrd.com eISSN: 2456-6470 Figure 11: Adsorption kinetic models (a) pseudo-first-order, (b) pseudo-second-order (c) Elovich and (d) Weber and Morris intra-particle diffussion equation, for biosorption of Lead (II) biosorption by Polyvinyl alcohol- alginate- Glutaraldehyde immobilized Sugarcane bagasse (Saccharum offcinarum L.) (biosorbent dose concentration: 5 g/L, Lead (II) concentration: 10 mg/L, contact time: 180 minutes, temperature: 300C) Figure 12: Plot of lnKc against 1/T for determination of thermodynamic parameters for Lead (II) biosorption by Polyvinyl alcohol- alginate- Glutaraldehyde immobilized Sugarcane bagasse (Saccharum offcinarum L.) (biosorbent dose concentration: 5 g/L, Lead (II) concentration: 10 mg/L, contact time: 180 minutes, temperature: 300C) Table 1: Adsorption isotherm constants for Lead (II) biosorption by Polyvinyl alcohol- alginate- Glutaraldehyde immobilized Sugarcane bagasse (Saccharum offcinarum L.) Langmuir parameters Freundlich parameters DKR parameters Temkin parameters qm 131. 5789 B R2 K 1/n R2 Β qm E R2 AT bT 183. 7850 R2 -4×10- 7 0.0302 0.9999 7.4404 0.8716 0.9959 27.1614 1.5812 0.7601 1.2609 0.8938 Table 2: Adsorption kinetic data for for Lead (II) biosorption by Polyvinyl alcohol- alginate- Glutaraldehyde immobilized Sugarcane bagasse (Saccharum offcinarum L.) Pseudo-first-order model model qe k1 R2 qe k2 R2 Pseudo-second-order Intraparticle diffusion model Ki C Elovich model ɑ β R2 R2 0.2516 0.0545 0.7545 1.8960 0.5812 1.0000 1.0168×10¹⁰ 16.2074 0.7521 0.0151 1.7164 0.5917 Table 3: Thermodynamic parameters of Lead (II) biosorption by Polyvinyl alcohol- alginate- Glutaraldehyde immobilized Sugarcane bagasse (Saccharum offcinarum L.) Sr. No. Time (min) K Kc -∆G0 ∆H0 ∆S0 1 200C 293 10.6550 5.763 2 250C 298 15.1030 6.726 45.835 175.716 3 300C 303 18.4931 7.349 4 400C 313 17.4842 7.445 @ IJTSRD | Unique Reference Paper ID – IJTSRD21554 | Volume – 3 | Issue – 2 | Jan-Feb 2019 Page: 942
International Journal of Trend in Scientific Research and Development (IJTSRD) @ www.ijtsrd.com eISSN: 2456-6470 [9] Naiya T. K., Das S. K. and Bhattacharya A. K., (2009). Adsorption of Cd (II) & Pb (II) from aqueous solution on activated alumina. J. Coll. Inter. Sci., 21, 434-451. References: [1]Biosorption of Cd (II), Cr (III) and Cr (VI) by saltbush (Atriplex canescens) biomass: Thermodynamic and isotherm studies, J. Colloid Interface Sci., 300, 100-104. [10]Olivieri N. F. and Brittenham G. M., (1997). Ironchelating therapy thalassemia. Blood, 89, 739-761. 23. Sawalha, M. F. and Peralta-Videa, J. R., RomeroGonzalez, J. and Gardea- Torresdey, J. L., (2006). [2] Catena G. C. and Bright F. V., (1989). Thermodynamic study on the effect of cyclodixtrin inclusion with aniline naphthalene sulphonates. Anal. Chem., 61, 905-909. and the treatment of [3]Dubinin, M. M. and Radushkevich, L.V., 1947. Equation of the characteristic curve of activated charcoal, Proc. Academy of Sci. Phy. Chem. Section, U.S.S.R. 55, 331- 333. [11] Panday K. K., Prasad G. and Singh V. N., (1986). Mixed adsorbents for Cu (II) removal from aqueous solutions. Environ. Technol. Lett., 50, 547-550. [4]Freundlich, H.M.F., 1906.Uber dies adsorption in losungen, Zeitschriftfue (Leipzig). A57, 385-470. [12]Thomas, J. M. and Thomas, W. J., (1997). Principle and Practice of heterogeneous catalysis, weinheim, VCH. 21. Malkoc E. and Nuhoglu Y. J., (2005). Investigation of Nickel (II) removal from aqueous solutions using tea factory waste, J. Hazard. Mater, B127, 120-128. Physikalische Chemie [5] Gadd, G. M., 1992.Metals and microorganisms: a problem of definition. FEMS Microbiol Lett. 100, 197– 204. 11. Septhum, C., Rattanaphani, S., Bremner, J. B. and Rattanaphani, V., 2007. An adsorption of Al (III) ions onto chitosan. J. Hazardous Materials. 148, 185- 191. [13] Veglio, F. and Beolchini, F., 1997. Removal of heavy metals by biosorption: A review. Hydrometallurgy. 44, 301-316. [14] Weber, W. J. and Morris, J.C., 1963. Kinetics of adsorption on carbon solution. J. Sanit. Eng. Div. Am. Soc. Civ. Engg. 89, 31-59. [6]Karthikeyan S., Balasubramanian R. and Iyer C. S. P., 2007. Evaluation of marine algae Uiva fasciata and Sargassum sp. for biosorption of Cu (II) from aqueous solutions. Bioresour. Technol., 98 (2), 452-455. [15]Temkin, M.J. and Pyzhev, V., 1940. Kinetics of ammonia synthesis on promoted iron catalysts. ActaPhysiochim. Urrs. 12, 217-222. [7]Langmuir, I., 1918. The adsorption of gases on plane surface of glass, mica and platinum, J. Am. Chem. Soc. 40, 1361-1403. [16]Young, RV. ed. World of Chemistry. Michigan: Gale Group, 2000. [8]McKay, G., Ho, Y.S. and Ng, J.C.Y., 1999. Biosorption of copper from waste waters: A review, Sep. Purif. Methi. 28, 87-125. @ IJTSRD | Unique Reference Paper ID – IJTSRD21554 | Volume – 3 | Issue – 2 | Jan-Feb 2019 Page: 943