Download
1 / 5
50 likes | 57 Views
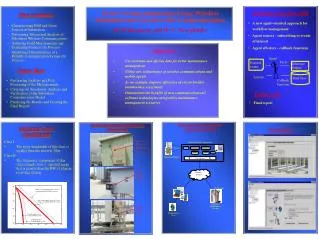
The boaters may sometimes cross their area limit without their knowledge. This causes a lot of problems. They may be caught by the other peoples. This project is developed for the boat users to find out their border in the sea area. The main modules in this project are RF transducer, microcontroller unit and LCD display. The Zigbee transmitter is connected at the border area. It transmits RF signals within the particular limit. The Zigbee receiver with the micro controller unit is connected at the boat. When the boat reaches the particular area, the RF signals are received by the receiver and given to the micro controller unit. The micro controller analyses the signal and calculates the distance and sends corresponding message to the LCD display. If it crosses the limit, the micro controller operates the warning buzzer and it switches off the running motor of the boat. Thus the boat may be automatically off and the boater may easily understand the situation. The micro controller program is written in embedded c language and the microcontroller used is ARDUINO. R. Mahalakshmi "Wireless Linked Navel Substation for International Boundary Scanning and Surveillance System Using GPS" Published in International Journal of Trend in Scientific Research and Development (ijtsrd), ISSN: 2456-6470, Volume-2 | Issue-6 , October 2018, URL: https://www.ijtsrd.com/papers/ijtsrd18437.pdf Paper URL: http://www.ijtsrd.com/engineering/computer-engineering/18437/wireless-linked-navel-substation-for-international-boundary-scanning-and-surveillance-system-using-gps/r-mahalakshmi<br>

E N D
International Journal of Trend in International Open Access Journal International Open Access Journal | www.ijtsrd.com International Journal of Trend in Scientific Research and Development (IJTSRD) Research and Development (IJTSRD) www.ijtsrd.com ISSN No: 2456 ISSN No: 2456 - 6470 | Volume - 2 | Issue – 6 | Sep 6 | Sep – Oct 2018 Wireless Linked Navel Substation Scanning and reless Linked Navel Substation for International Boundary nd Surveillance System Using GPS R. Mahalakshmi Leturer, Department of Computer Engineering, Polytechnic College, Kotagiri,Tamil Nadu,India nternational Boundary GPS Leturer, Department NPA Centenary Polytechnic India ABSTRACT The boaters may sometimes cross their area limit without their knowledge. This causes a lot problems. They may be caught by the other peoples. This project is developed for the boat users to find out their border in the sea area. The main modules in this project are RF transducer, microcontroller unit and LCD display. The Zigbee transmitter is c the border area. It transmits RF signals within the particular limit. The Zigbee receiver with the micro controller unit is connected at the boat. When the boat reaches the particular area, the RF signals are received by the receiver and given to the micro controller unit. The micro controller analyses the signal and calculates the distance and sends corresponding message to the LCD display. If it crosses the limit, the micro controller operates the warning buzzer and it switches off the running motor of the boat. Thus the boat may be automatically off and the boater may easily understand the situation. The micro controller program is written in embedded c language and the microcontroller used is ARDUINO. Keyword: Air pollution, wireless sensor carbon monoxide, smoke, PHP-MYSQL, Lab I. INTRODUCTION There Have Been Several Alleged Incidents on Indian Fishermen Fishing In Palk Government Has Always Taken Up The Issue Safety Of Indian Fishermen On A Priority Basis With The Government Of Sri Lanka. Presently Bona fide Indian Fisherman in the Custody. A Joint Working Group (JWG Constituted To Deal With The Issues Related To Indian Fishermen Straying In Sri Lankan Waters, Work Out Modalities For Prevention Of Force Against Them And The Early Release Force Against Them And The Early Release Of Confiscated Boats And Explore Possibilities Working Towards Bilateral Arrangements For Licensed Fishing. The JWG India Officially Protested Against Its Alleged Involvement In Attacks On Fishermen On January 12, 2011. Official Protest, Another Fisherman Was Killed In A Brutal Manner On Jan 22, 2011. Have Been Killed In The Last 30 Years. Apathetic Attitude Of The Indian The National Media Towards The Alleged Killing Tamil Nadu Fishermen By The Being Strongly Condemned. II. PROPOSED SYSTEM It Consists Of Client Side Module Which Is Placed On The Boat And Server Side Module. Consists Of Microcontroller Unit Connected To The GPS Transceiver And Indication Unit Buzzer. Server Module Consists Unit And GPS Transceiver. Zigbee Is A Specification For A Suite Communication Protocols Used To Create Personal Area Networks Built From Small, Low Radios. Zigbee Is Based On An Standard. Though Low Powered, Zigbee Devices Can Transmit Data Over Long Distances By Passing Data Through Intermediate Devices To Reach More Distant Ones, Creating A Mesh Network; I.E., A Network With No Centralized Control Or High Transmitter/Receiver Able To Reach All Networked Devices. The Decentralized Nat Such Wireless Ad Hoc Networks Makes Them Suitable For Applications Where A Central Node Can't Be Relied Upon. he boaters may sometimes cross their area limit without their knowledge. This causes a lot of problems. They may be caught by the other peoples. This project is developed for the boat users to find out their border in the sea area. The main modules in this project are RF transducer, microcontroller unit and LCD display. The Zigbee transmitter is connected at the border area. It transmits RF signals within the particular limit. The Zigbee receiver with the micro controller unit is connected at the boat. When the boat reaches the particular area, the RF signals are received to the micro controller unit. The micro controller analyses the signal and calculates the distance and sends corresponding message to the LCD display. If it crosses the limit, the micro controller operates the warning buzzer and it Confiscated Boats And Explore Possibilities Of Working Towards Bilateral Arrangements For Last Met In Jan 2006. ficially Protested Against Sri Lanka Navy For Its Alleged Involvement In Attacks On Indian 12, 2011. Even After The ficial Protest, Another Fisherman Was Killed In A 22, 2011. Over 530 Fishermen e Been Killed In The Last 30 Years. The Indian Government And The National Media Towards The Alleged Killing Of Fishermen By The Sri Lankan Navy Is PROPOSED SYSTEM Side Module Which Is Placed Side Module. Client Module Microcontroller Unit Connected To The Transceiver And Indication Unit Of LED And Module Consists Of System Control the boat. Thus the f and the boater may easily understand the situation. The micro controller program is written in embedded c language and the e Is A Specification For A Suite Of High Level Communication Protocols Used To Create Personal Area Networks Built From Small, Low-Power Digital Radios. Zigbee Is Based On An IEEE 802.15 Low Powered, Zigbee Devices Can ong Distances By Passing Data Through Intermediate Devices To Reach More Distant Ones, Creating A Mesh Network; I.E., A Network With No Centralized Control Or High-Power Transmitter/Receiver Able To Reach All Of The Air pollution, wireless sensor system, MYSQL, Lab VIEW Been Several Alleged Incidents of Firing Palk Bay [Indian Has Always Taken Up The Issue of Fishermen On A Priority Basis With Presently There Is No in the Sri Lankan JWG) Has Been Decentralized Nature Of Constituted To Deal With The Issues Related To Such Wireless Ad Hoc Networks Makes Them Suitable For Applications Where A Central Node Lankan Territorial Waters, Work Out Modalities For Prevention Of Use @ IJTSRD | Available Online @ www.ijtsrd.com www.ijtsrd.com | Volume – 2 | Issue – 6 | Sep-Oct 2018 Oct 2018 Page: 261
International Journal of Trend in Scientific Research and Development (IJTSRD) ISSN: 2456 International Journal of Trend in Scientific Research and Development (IJTSRD) ISSN: 2456 International Journal of Trend in Scientific Research and Development (IJTSRD) ISSN: 2456-6470 III. The Sensor Platform Supports Data Collection, Storage and Offline Data Retrieval, Be Used For The Streaming Of System Can Be Accessed Through A This Wired Interface Provides Power To The Board. And This Power Can Be Used For On Operation. Location and Provided By an On-Board GPS Sampling Rate. Pollutant Levels Are Measured Two Ana log Sensors: Viz LM35 Readings Along With GPS Information Are Stored In A Serial Flash Device 2MB. A 16X2 Panel Provides Immediate Visualization Pollutant; GPS Readings.PIC 16F877 Controls Every Aspect Of The System From Battery Charging To Ana log To Digital Single chip Microcontroller That Has Built-In Resources Like Digital Ports, 16 Channels, 8/10 Bits Converter, 8 Input/output Interrupt RAM, EEPROM, FEEPROM Communication Ports, And SPI The Data Packet From The GPS RMS Header Followed By Longitude.. The GPS Modem Is Interfaced With The Microcontroller Using The RS Standard. The Central-Server With Accessibility To The Server Is Connected To The Zigbee 232 Communication Standard. Information Is Saved To Database Each Of These Components Following. HARDWARE DESCRIPTION HARDWARE DESCRIPTION Sensor Platform Supports Data Collection, fline Data Retrieval, They May Also Of Live Sensor Readings. Can Be Accessed Through A USB Cable. Wired Interface Provides Power To The Board. Be Used For On-Line Time Information Is GPS Module At 1 Hz Levels Are Measured by LM35 and TGS 813. These Information Are Stored In A 16X2 Character LCD Panel Provides Immediate Visualization Of Level Of PIC 16F877 Microcontroller The System From Battery To Digital Conversions. A PIC 16F877 Is Device In Resources Like Digital Input/output Ports, 16 Channels, 8/10 Bits Ana log-To-Digital Figure1. Overall System Overall System Interrupt-Driven Timers, FEEPROM Memory, RS-232 Serial SPI Communication Ports GPS-Module Includes An UTC Time, Latitude, Modem Is Interfaced With The RS-232 Communication Server Is Personal Computer Internet. The Pollution Is Connected To The Zigbee-Modem Via RS- 232 Communication Standard. The Air Pollution Information Is Saved To Database Of Central Server. These Components Is Described In The Microcontroller Microcontroller Is The Main A Pollution Detection Unit. The Operating System That Runs Inside The Chip Coordinates The Substances Measurement Process, GPS Coordinates And The Data Transmission To The Central Server. The Microcontroller Is Mounted On A Development Board That Provides Zigbee Modem And GPS Receiver And A Parallel Connection To The Gas Connection Between The Gas Sensors Microcontroller Can’t Be A. PIC16F877A Microcontroller The PIC16F877A Microcontroller Is The Main Component Of A Pollution Detection Unit. Operating System That Runs Inside The Chip Coordinates The Substances Measurement Process, The Acquisition Of The GPS Data Transmission To The Central Server. Microcontroller Is Mounted On A Development Board That Provides Communication To The Zigbee Receiver And A Parallel Connection To The Gas Sensors. The Connection Between The Gas Sensors And The PIC16F877A Microcontroller Can’t Be Made Directly Because Of The Very Small Output Voltages Provided By The Sensors (Ma). Problem Is Solved By Using Auxiliary Electronic Circuits For Signal Conversion Like Amplifiers) And Transistors. Figure2. System Hardware At Transmitter Side Hardware At Transmitter Side An An RS232 Serial The Very Small Output he Sensors (Ma).This Problem Is Solved By Using Auxiliary Electronic Circuits For Signal Conversion Like OA (Operational Figure3. System Hardware At Receiver Side Hardware At Receiver Side @ IJTSRD | Available Online @ www.ijtsrd.com www.ijtsrd.com | Volume – 2 | Issue – 6 | Sep-Oct 2018 Oct 2018 Page: 262
International Journal of Trend in Scientific Research and Development (IJTSRD) ISSN: 2456 International Journal of Trend in Scientific Research and Development (IJTSRD) ISSN: 2456 International Journal of Trend in Scientific Research and Development (IJTSRD) ISSN: 2456-6470 B. Sensors Array The Sensor Array Consists Of Two Air Pollutions Sensors. Each Of The Sensors Has A Linear Current Output In The Range Of 4 Ma–20 Ma. Output Corresponds To Zero-Level Gas And The 20 Ma Corresponds To The Maximum Gas Level. Simple Signal Conditioning Circuit Is Designed Convert the 4 Ma–20 Ma Range Into 0 Compatible with the Voltage Range of Ana log-To-Digital Converter Microcontroller. C. GPS Reciever The GPS Module Provides The Physical Coordinate Location Of The Mobile-DAQ, Time And Date In National Marine Electronics Association Format. NEMA Format Includes The Complete Position, Velocity, And Time Computed By A Receiver Where The Position Is Given In Latitude And Longitude. The Data Packet From The Module Includes An RMS Header Followed By Time, Data Validity Checksum, Latitude, Longitude, Velocity, Heading, Date, Magnetic Variation And Direction, Mode, And Checksum. Information Required For The Proposed System Is Date, Time, Latitude And Longitude. Modem Is Interfaced With The Microcontroller Using The RS-232 Communication Standard. D. Zigbee Modules In This Paper, Two Types Zigbee Modules Are Used To Organize A Network For Air Pollution Monitoring System. The Network Is Controlled By Devices Called The Zigbee Coordinator Modem Zcms Are Responsible For Collecting Data And Maintaining The Other Devices On The Network, And All Other Devices, Known As Devices (ZED), Directly Communicate With The ZCM. The Zigbee Module Is Hardware Platf Wireless Device. Modules Realize The Basic Function Of Physical Layer, Such As Transmit And Receive, Modulation And Demodulation, Channel And Power The Modules Realize The Basic Function And MAC Layer, Such As Transmit And Receive, Modulation And Demodulation, Channel And Power Control. Two Air Pollutions The Sensors Has A Linear Current 20 Ma. The 4 Ma Level Gas And The 20 Ma Corresponds To The Maximum Gas Level. A Is Designed to 20 Ma Range Into 0–5 V to Be of The Built-In The in in PIC Module Provides The Physical Coordinate , Time And Date In National Marine Electronics Association (NMEA) Format Includes The Complete Position, Velocity, And Time Computed By A GPS Receiver Where The Position Is Given In Latitude Data Packet From The GPS- Figure5. Freguency Bands For Bands For Zigbee Zigbee Operate At 2.4 GHz Wireless Communication. The Digital Direct Sequence Spread Spectrum Base Band Modem and an Effective Data Rate They Employ the EM2420 2.4 GHz Transceiver and the Microcontroller. They Also Exhibit A Nominal Transmit Of -1.5dbm And A Receive Sensitivity 92dbm When Powered At 3.0V 31.0ma In Transmit Mode And 28ma In Receive Mode. When The Entire Module Is In Sleep Mode, The Current Draw Is Reduced To Approximately 10ua. E. Central Server The Central-Server Is An Of Personal Computer With Accessibility To The Internet. The Pollution-Server Zigbee-Modem Via RS Standard. The Air Pollution Information Sent From Each ZED Are Collected To Data Are Saved To Database Figure 5 Block Diagram of Zigbee Module Clients Such As The Municipality, Environmental Protection Agencies, Travel Agencies, Insurance Companies And Tourist Companies Can Connect To The Central-Server Through The The Real-Time Air Pollutants Level Using A Normal Browser On A Standard PC Or A Mobile Device. IV. System Implementation The Sensor Output Voltages Representing The Level Of Gas For Each Pollutant Were Converted To A Ppm Value For Each Gas And Simultaneously Displayed On The LCD Display Display Of The Hardware. 2.4 GHz Frequency ISM Band The Modules Include A Digital Direct Sequence Spread Spectrum Base Band Effective Data Rate Of 250 Kbps. Followed By UTC 2.4 GHz Radio Frequency 8-Bit Time, Data Validity Checksum, Latitude, Longitude, Velocity, Heading, Date, Magnetic Variation And Direction, Mode, And Checksum. The Only Information Required For The Proposed System Is Date, Time, Latitude And Longitude. The GPS Is Interfaced With The Microcontroller Using ATMEL ATMEL Also Exhibit A Nominal 1.5dbm And A Receive Sensitivity Of - 0V, The Modules Draw 31.0ma In Transmit Mode And 28ma In Receive The Entire Module Is In Sleep Mode, he Current Draw Is Reduced To Approximately AVR This Paper, Two Types Zigbee Modules Are Used To Organize A Network For Air Pollution Monitoring Network Is Controlled By Devices Zigbee Coordinator Modem (ZCM). The Zcms Are Responsible For Collecting Data And Maintaining The Other Devices On The Network, And All Other Devices, Known As Zigbee End ), Directly Communicate With The Zigbee Module Is Hardware Platform Of Off-The-Shelf Standard Personal Computer With Accessibility To The Server Is Connected To The -232 Communication Air Pollution Information Sent From Are Collected To ZCM. And Then The Data Are Saved To Database Of Central Server. Zigbee Module Such As The Municipality, Environmental ion Agencies, Travel Agencies, Insurance Companies And Tourist Companies Can Connect To Through The Internet And Check Time Air Pollutants Level Using A Normal Or A Mobile Device. System Implementation and the Resuls Sensor Output Voltages Representing The Level Gas For Each Pollutant Were Converted To A Ppm Value For Each Gas And Simultaneously Figure4. Protocols Stack For Layered Wireless Communication Stack For Layered Wireless @ IJTSRD | Available Online @ www.ijtsrd.com www.ijtsrd.com | Volume – 2 | Issue – 6 | Sep-Oct 2018 Oct 2018 Page: 263
International Journal of Trend in Scientific Research and Development (IJTSRD) ISSN: 2456 International Journal of Trend in Scientific Research and Development (IJTSRD) ISSN: 2456 International Journal of Trend in Scientific Research and Development (IJTSRD) ISSN: 2456-6470 V. The System Detects Temperature And Smoke Emissions By Using Sensors Lm35 And Tgs 813 Which Is Commercially Available In The Local Market Makes It More Convenient And Variably Cheaper Compared To Pre-Ordered Sensors Abroad. This Sensor Saves 1/7 Of Power Co Data Were Treated Using A Developed Lab Based Program. The System’s Overall Functionality Was Verified with Series of Temperature and Smoke Level Tests Including Tests in a Normal or Environment, Cigarette Smoke, And Car Exhaust Emission on Different Time Intervals. The Cigarette Smoke Tests Showed That Carbon Monoxide Reading Is 6 Times Greater Than The Smoke Reading And For The Car Exhaust Tests It Showed The Carbon Monoxide Reading Is 4 Times Greater Than Smoke Reading. Systematized Data Logging Was Also Done To Back Up Every Result Which Will Be Reference During Erroneous Reading, Debugging And Calibration. The Results Were Processed Automatically Using A Lab view And My Program With Output Published In Php Which Is Readily Available For Uploading In The Internet. The System Provided A Low Cost Data Acquisition Of Temperature And Smoke Pollutants That Can Be Read Online For Air Pollution Monitoring For Environmental Awareness. VI. FUTURES COPE In Order To Make The Present Design More Realistic With Low Power By Replacing The Semiconductor Sensor, It Is Possible To Use Nano The Solar Power Base System Design Can Be Made Possible. For Longer Distance Communication We Can Use Gsm System Also We Can Control The Air Pollution By Using Sensed Data As Command. REFERENCES 1.Alave, K., (2010). DENR Issues New Limits Vehicular Emissions To Philippine Daily Inquirer, 2.Ageitos, M., Guerrero, P Effects Of Introducing Hybrid Cars Barcelona Metropolitan Areas Management Strategies HARMO12-Conference, Pages 1 3.Australianbureau Of Environmental Awareness And Social Trends. 4102.0, Pages 1 Pages 1-5 CONCLUSION The System Detects Temperature And Smoke Emissions By Using Sensors Lm35 And Tgs 813 Which Is Commercially Available In The Local Market Makes It More Convenient And Variably Ordered Sensors Abroad. Power Consumption. All Data Were Treated Using A Developed Lab view- Based Program. The System’s Overall Functionality Temperature and Smoke Level Tests Including Tests in a Normal or Clean Environment, Cigarette Smoke, And Car Exhaust Different Time Intervals. The Cigarette Smoke Tests Showed That Carbon Monoxide Reading Is 6 Times Greater Than The Smoke Reading And For The Car Exhaust Tests It Showed The Carbon Monoxide Reading Is 4 Times Greater Than Smoke ized Data Logging Was Also Done To Back Up Every Result Which Will Be Of Valuable Reference During Erroneous Reading, Debugging And Calibration. The Results Were Processed Figure6. Snapshot Of Pollutant Level On Pollutant Level On LCD The Values Of The Level Of Temperature From The Serial Port Is Taken In Account By The Lab view Software Which Is Used To Display These Data In Their Respective Textbox And Also It Displayed In The Form Of Waveforms In Two Different Panel. The of the Computer Window for the Lab view Designed Page Is Shown Below. Smoke And Temperature From The Serial Port Is Taken In tware Which Is Used To Display These Data In Their Respective Textbox Of Continuous The Screenshot view Designed view And My sql-Based Program With Output Published In Php Format Which Is Readily Available For Uploading In The Internet. The System Provided A Low Cost Data Temperature And Smoke Pollutants That Can Be Read Online For Air Pollution Monitoring For Environmental Awareness. In Order To Make The Present Design More Realistic With Low Power By Replacing The Semiconductor Sensor, It Is Possible To Use Nano SENSOR; So That The Solar Power Base System Design Can Be Made Possible. For Longer Distance Communication We stem Also We Can Control The Air Pollution By Using Sensed Data As Command. Figure7. Snapshot Of Output Window Output Window – After Start Sensing The Air Pollution Monitoring System Includes Feature Which Automatically Publishes the Results into Hyper Text Mark up Language Figure 8 Shows The Interface Of The Website. Air Pollution Monitoring System Includes a Automatically Publishes the Results Language (Html). The The Website. DENR Issues New Limits On To Cut Air Pollution. Pages 12-13. ., Baldasano, J. (2008). Introducing Hybrid Cars In Madrid And Barcelona Metropolitan Areas. Air Quality Management Strategies Pages 1-16. In Urban Areas, Statistics. (2010). Awareness And Action. Australian Figure8. Air Pollution Monitoring Web Interface Air Pollution Monitoring Web Interface @ IJTSRD | Available Online @ www.ijtsrd.com www.ijtsrd.com | Volume – 2 | Issue – 6 | Sep-Oct 2018 Oct 2018 Page: 264
International Journal of Trend in Scientific Research and Development (IJTSRD) ISSN: 2456 International Journal of Trend in Scientific Research and Development (IJTSRD) ISSN: 2456 International Journal of Trend in Scientific Research and Development (IJTSRD) ISSN: 2456-6470 4.Bagula, A., Inggs, G., Scott, S., (2010). Community Application To Communications And Information Conference 2010. 5.Bashyal, S., Venayagamoorthy, Collaborative Routing Algorithm Sensor Network Longevity. Real-Time Power Intelligent System.ISSNIP1-4244-1502, – 521 6.Burgonio, T. (2007). Air Pollution Kills Nearly 5,000 Metro Residents Yearly. Philippine Daily Inquirer, Pages 5 Http://Newsinfo.Inquirer.Net 7.Choi, S., Kim, N., Cha, H., Ha, R., (2009). Sensor Node For Air Pollutant Monitoring Hardware And Software Issues. Sensors 1424-82, Pages 7970 - 7987 8.Clean Air Initiative For Asian Cities Center. (2010). Air Quality Monitoring Reporting. Air Quality In Asia: Trends.2010 Edition, Page 13. 9.Congressional Commission Technology, And Engineering. (2010). Pollution Leading Cause Of Anemia Kidney Problems. Press Release – Angara 10.Coyle, E., Bandyopadhyay, S. (2003). Efficient Hierarchical Clustering Algorithm Wireless Sensor Networks. IEEE INFOCOM 2003, Pages 7803-7753 11.Denig. S. (2011). Assessing The Environmental Performance Of Asia’s Major Cities City Index. Release No. A19100-F- Pages 4-63 12.Environmental Management Bureau Department Of Environment And Natural Resources National Air Quality Status Report Pages 11 - 41. Retrieved From Http://Emb.Gov.Ph 13.Houk, J., Clagett M. (2009). Management: Successes Challenges.THE ENVIRONMENT TRANSPORTATION Making Both Better Than Before, TR NEWS 262, Pages 8-12. 14.Dr Invernizzi, G. (2004). Particulate Matter Tobacco Versus Diesel Car Exhaust Control Unit, National Cancer Institute From: ., Zenarro, M. Networks:An Wireless Http://Www.Medicalnewstoday.Com/Releases/12 481.Php 15.Irudhayarj, A., Jaichandran System For Monitoring Greenhouse Gases. World And Information Technology Journal Vol. 1, No. 5, Pages 177-183. 16.Khedo, K., Perseedoss, R., Wireless Sensor Network Air Pollution Monitoring System. International Journal Mobile Network, Vol. 2, No 17.Ma, Y., Richards, M., Ghanem Hassard, J. (2008). Air Pollution Monitoring Mining Based On Sensor Grid 2008, ISSN 1424-8220, Pages 3601 18.National Statistical Coordination Board Pollutants From Different Sources, Philippine Brown Environment Quality 2005. Pages 1-2 19.Prasad, R., Baig, M., Mishra Desai, U., Merchant, S Wireless Air Pollution Monitoring System Generation Wireless Networks Volume – 2, Issue – 2, Pages 370 20.Stankovic, J. (2006). Wireless Sensor Networks Department Of Computer Science University Virginia Journal, Volume 10, Pages 5 21.U.S. Environmental Protection Air Quality Index. A Guide Your Health. EPA-456/F-09 22.Xiang, Y., Bai, L., Piedrahita Hannigan, M., Shang, L Calibration and Sensor Placement Sensor Networks. Networks : Network Architecture IPSN’12, Pages 1 – 12 Http://Www.Medicalnewstoday.Com/Releases/12 Community Sensor Sensor Networks Maps Maps. Pollution Pollution Information Conference, Jaichandran, R., (2011). Prototype Monitoring And World Of Computer Science Information Technology Journal (WCSIT). 183. Computing G. (2007). For Wireless Time Power And 1502, Pages 515 ., Mungur, A. (2010). A Wireless Sensor Network Air Pollution Monitoring International Journal Of Wireless & No. 2, Pages 1 - 15 Pollution Kills Nearly Philippine Daily Ghanem, M., Guo, Y., Air Pollution Monitoring And Sensor Grid In London. Sensors Pages 3601 -3623 - 6Retrieved 6Retrieved From ., (2009). Micro Air Pollutant Monitoring: Sensors. ISSN National Statistical Coordination Board. (2004). From Different Sources, Metro Manila. Philippine Brown Environment Quality.AG-12- Asian Cities (CAI-ASIA) Air Quality Monitoring And Mishra, R., Rajalakshmi, P., S. (2011). Real Time : Status And Wireless Air Pollution Monitoring System. Next Generation Wireless Networks And Applications. Pages 370 – 375 o on Science . (2010). Air Anemia, Infertility, Angara. Wireless Sensor Networks. Computer Science University Of 10, Pages 5-25. . (2003). An Energy Efficient Hierarchical Clustering Algorithm For Environmental Protection Agency. (2009). A Guide to Air Quality and 09-002, Pages 3 – 12 IEEE INFOCOM The Environmental Major Cities. Asian Green F-P171-X-7600, Piedrahita, R., Dick, R., Lu, Q., L. (2012). Collaborative Sensor Placement for Mobile Computer Computer-Communication Network Architecture And Design, Environmental Management Bureau Department Natural Resources. (2009). National Air Quality Status Report, 2005-2007, From Http://Emb.Gov.Ph Air Quality Emerging And And THE ENVIRONMENT AND AND TRANSPORTATION Making Both Better Than Particulate Matter From Diesel Car Exhaust. Tobacco National Cancer Institute. Retrieved @ IJTSRD | Available Online @ www.ijtsrd.com www.ijtsrd.com | Volume – 2 | Issue – 6 | Sep-Oct 2018 Oct 2018 Page: 265