Download
1 / 5
50 likes | 51 Views
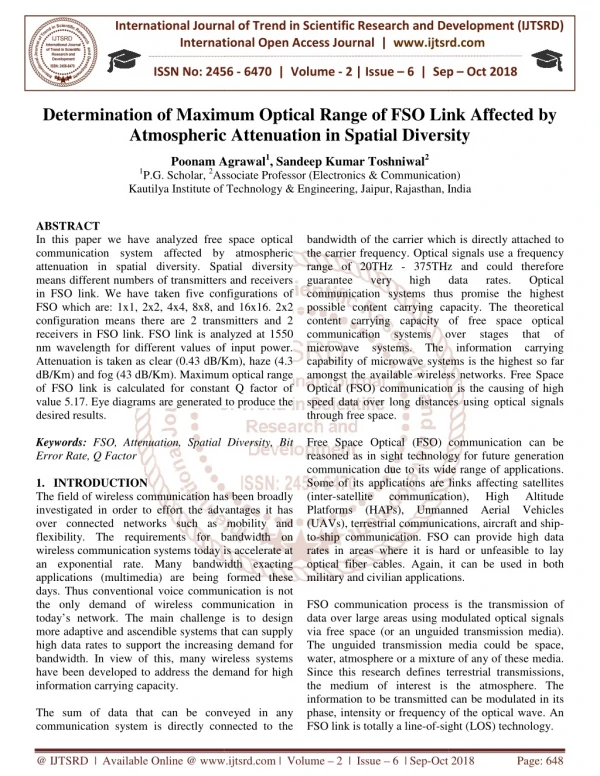
In this paper we have analyzed free space optical communication system affected by atmospheric attenuation in spatial diversity. Spatial diversity means different numbers of transmitters and receivers in FSO link. We have taken five configurations of FSO which are 1x1, 2x2, 4x4, 8x8, and 16x16. 2x2 configuration means there are 2 transmitters and 2 receivers in FSO link. FSO link is analyzed at 1550 nm wavelength for different values of input power. Attenuation is taken as clear 0.43 dB Km , haze 4.3 dB Km and fog 43 dB Km . Maximum optical range of FSO link is calculated for constant Q factor of value 5.17. Eye diagrams are generated to produce the desired results. Poonam Agrawal | Sandeep Kumar Toshniwal "Determination of Maximum Optical Range of FSO Link Affected by Atmospheric Attenuation in Spatial Diversity" Published in International Journal of Trend in Scientific Research and Development (ijtsrd), ISSN: 2456-6470, Volume-2 | Issue-6 , October 2018, URL: https://www.ijtsrd.com/papers/ijtsrd18261.pdf Paper URL: http://www.ijtsrd.com/engineering/electronics-and-communication-engineering/18261/determination-of-maximum-optical-range-of-fso-link-affected-by-atmospheric-attenuation-in-spatial-diversity/poonam-agrawal<br>

E N D
International Journal of Trend in International Open Access Journal International Open Access Journal | www.ijtsrd.com International Journal of Trend in Scientific Research and Development (IJTSRD) Research and Development (IJTSRD) www.ijtsrd.com ISSN No: 2456 ISSN No: 2456 - 6470 | Volume - 2 | Issue – 6 | Sep 6 | Sep – Oct 2018 Determination of Maximum Optica Atmospheric Attenuation in Spatial Diversity Atmospheric Attenuation in Spatial Diversity Atmospheric Attenuation in Spatial Diversity Determination of Maximum Optical Range of FSO Link Affected by l Range of FSO Link Affected by Poonam Agrawal1, Sandeep Kumar Toshniwal2 Associate Professor (Electronics & Communication Electronics & Communication) Poonam Agrawal 1P.G. Scholar, 2Associate Professor Kautilya Institute of Technology & Engineering, Jaipur Institute of Technology & Engineering, Jaipur,Rajasthan, India India ABSTRACT In this paper we have analyzed free space optical communication system affected by atmospheric attenuation in spatial diversity. Spatial diversity means different numbers of transmitters and receivers in FSO link. We have taken five configurations of FSO which are: 1x1, 2x2, 4x4, 8x8, and 16x16. 2x2 configuration means there are 2 transmitters and 2 receivers in FSO link. FSO link is analyzed at 1550 nm wavelength for different values of input power. Attenuation is taken as clear (0.43 dB/Km), haze (4.3 dB/Km) and fog (43 dB/Km). Maximum optical range of FSO link is calculated for constant Q factor of value 5.17. Eye diagrams are generated to produce the desired results. Keywords:FSO, Attenuation, Spatial Diversity, Bit Error Rate, Q Factor 1.INTRODUCTION The field of wireless communication has been broadly investigated in order to effort the advantages it has over connected networks such as mobility and flexibility. The requirements for bandwidth on wireless communication systems today is accelerate at an exponential rate. Many bandwidth exacting applications (multimedia) are being formed these days. Thus conventional voice communication is not the only demand of wireless communication in today’s network. The main challenge is to design more adaptive and ascendible systems that can supply high data rates to support the increasing demand for bandwidth. In view of this, many wireless systems have been developed to address the demand for high information carrying capacity. The sum of data that can be conveyed in any communication system is directly connected to the communication system is directly connected to the bandwidth of the carrier which is directly attached to the carrier frequency. Optical signals range of 20THz - 375THz and could therefore guarantee very high communication systems thus promise the highest possible content carrying capacity. The theoretical content carrying capacity of free space optical communication systems microwave systems. The information carrying capability of microwave systems is the highest so far amongst the available wireless networks. Free Space Optical (FSO) communication is the causing of high speed data over long distances using optical signals through free space. Free Space Optical (FSO) communication can be reasoned as in sight technology for future generation communication due to its wide range of applications. Some of its applications are links affecting satel (inter-satellite communication), Platforms (HAPs), Unmanned Aerial Vehicles (UAVs), terrestrial communications, aircraft and ship to-ship communication. FSO can provide high data rates in areas where it is hard or unfeasible to lay optical fiber cables. Again, it can be used in both military and civilian applications FSO communication process is the transmission of data over large areas using modulated optical signals via free space (or an unguided transmission media). The unguided transmission media could be space, water, atmosphere or a mixture of any of these media. Since this research defines terrestrial transmissions, the medium of interest is the atmosphere. The information to be transmitted can be modulated in its phase, intensity or frequency of the optical wave. An FSO link is totally a line-of-sight (LOS) technology. In this paper we have analyzed free space optical communication system affected by atmospheric attenuation in spatial diversity. Spatial diversity different numbers of transmitters and receivers in FSO link. We have taken five configurations of FSO which are: 1x1, 2x2, 4x4, 8x8, and 16x16. 2x2 configuration means there are 2 transmitters and 2 receivers in FSO link. FSO link is analyzed at 1550 avelength for different values of input power. Attenuation is taken as clear (0.43 dB/Km), haze (4.3 dB/Km) and fog (43 dB/Km). Maximum optical range of FSO link is calculated for constant Q factor of value 5.17. Eye diagrams are generated to produce the bandwidth of the carrier which is directly attached to the carrier frequency. Optical signals use a frequency 375THz and could therefore guarantee very high communication systems thus promise the highest possible content carrying capacity. The theoretical content carrying capacity of free space optical ation systems microwave systems. The information carrying capability of microwave systems is the highest so far amongst the available wireless networks. Free Space Optical (FSO) communication is the causing of high distances using optical signals data data rates. rates. Optical Optical over over stages stages that that of of Free Space Optical (FSO) communication can be reasoned as in sight technology for future generation communication due to its wide range of applications. Some of its applications are links affecting satellites satellite communication), Platforms (HAPs), Unmanned Aerial Vehicles (UAVs), terrestrial communications, aircraft and ship- ship communication. FSO can provide high data rates in areas where it is hard or unfeasible to lay cal fiber cables. Again, it can be used in both military and civilian applications. FSO, Attenuation, Spatial Diversity, Bit The field of wireless communication has been broadly investigated in order to effort the advantages it has over connected networks such as mobility and flexibility. The requirements for bandwidth on wireless communication systems today is accelerate at an exponential rate. Many bandwidth exacting applications (multimedia) are being formed these days. Thus conventional voice communication is not emand of wireless communication in today’s network. The main challenge is to design more adaptive and ascendible systems that can supply high data rates to support the increasing demand for bandwidth. In view of this, many wireless systems ped to address the demand for high High High Altitude Altitude FSO communication process is the transmission of data over large areas using modulated optical signals via free space (or an unguided transmission media). ansmission media could be space, water, atmosphere or a mixture of any of these media. Since this research defines terrestrial transmissions, the medium of interest is the atmosphere. The information to be transmitted can be modulated in its ty or frequency of the optical wave. An The sum of data that can be conveyed in any sight (LOS) technology. @ IJTSRD | Available Online @ www.ijtsrd.com www.ijtsrd.com | Volume – 2 | Issue – 6 | Sep-Oct 2018 Oct 2018 Page: 648
International Journal of Trend in Scientific Research and Development (IJTSRD) ISSN: 2456 International Journal of Trend in Scientific Research and Development (IJTSRD) ISSN: 2456 International Journal of Trend in Scientific Research and Development (IJTSRD) ISSN: 2456-6470 2.FEATURES The primary features of FSO technology are mentioned below: ?Large Bandwidth: The amount of data that can be transmitted in any communication channel is directly proportional to the bandwidth of the carrier which is directly proportional to the carrier frequency. The permissible data bandwidth may be up to 20% of the carrier frequency. Optical waves use a frequency range of 20THz and would therefore guarantee very large bandwidth or data rate. This is due to the electromagnetic spectrum, the optical carrier frequency which consists of visible, ultraviolet and infrared light are far larger than the radio frequency. ?Narrow Beam width: The beam width waves is very narrow. Common laser beams include diffraction limited divergence angle between 0.01 – 0.10mrad. This states that the optical power is confined within a narrow area and therefore needs a line-of-sight (LOS) between transmitter and receiver. Optical waves are protective to electromagnetic interference and give opportunity for unlimited frequency reuse because of this characteristic. ?Highly Secured: Optical waves are highly secured with low possibility of interception and low possibility of detection (LPI/LPD) characteristics. Laser beam produced by FSO systems is narrow and invisible. This makes them tough to capture and even more tough to crack. Optical waves cannot be detected with spectrum analyzers or RF meters. ?Weather dependency: FSO execution highly depends on the patterns of weather in the installation area because atmospheric situations like fog, rainfall, temperature, dust particles, atmospheric turbulence and smoke directly influence the availability and reliabilit FSO link. ?Unlicensed Spectrum: RF signals face a major challenge of interference due to congestion of the RF spectrum. Local regulatory bodies like Office of Communication in the United Kingdom, National Communications Authority (NCA) in Ghana, Federal Communication Commission in the United States Telecommunications in India observe the use of the RF spectrum in their concerned countries. To use RF spectrum needs license from the local bodies which cost a lot of money. The utiliza bodies which cost a lot of money. The utilization of the electromagnetic spectrum for FSO does not need any form of spectrum license from local bodies and therefore is a major cost benefit over the use of RF spectrum. ?Easy installation: The time it consumes for FSO link to become functional from its installation to its alignment is relatively small. The major requirement is to assure direct LOS without any kind of obstruction between the transmitter and receiver ends. This is not similar to the use of fiber optic cables which needs right trenching additional extra cost to the installation work. 3.PROPOSED DESIGNS We have used different configurations of FSO link and calculated range for each configuration keeping Q factor constant at 5.17. Different configurations are shown below: of the electromagnetic spectrum for FSO does not need any form of spectrum license from local bodies and therefore is a major cost benefit over The primary features of FSO technology are Large Bandwidth: The amount of data that can be transmitted in any communication channel is directly proportional to the bandwidth of the carrier which is directly proportional to the carrier frequency. The permissible data bandwidth may be up to 20% of the carrier frequency. Optical waves use a frequency range of 20THz - 375THz re guarantee very large bandwidth or data rate. This is due to the electromagnetic spectrum, the optical carrier frequency which consists of visible, ultraviolet and infrared light are far larger than the radio Easy installation: The time it consumes for FSO link to become functional from its beginning of installation to its alignment is relatively small. The major requirement is to assure direct LOS without any kind of obstruction between the transmitter and receiver ends. This is not similar to the use of fiber optic cables which needs right of way and trenching additional extra cost to the installation We have used different configurations of FSO link and calculated range for each configuration keeping Q factor constant at 5.17. Different configurations are Narrow Beam width: The beam width of optical waves is very narrow. Common laser beams include diffraction limited divergence angle 0.10mrad. This states that the optical power is confined within a narrow area and sight (LOS) between receiver. Optical waves are protective to electromagnetic interference and give opportunity for unlimited frequency reuse Highly Secured: Optical waves are highly secured with low possibility of interception and low ity of detection (LPI/LPD) characteristics. Laser beam produced by FSO systems is narrow and invisible. This makes them tough to capture and even more tough to crack. Optical waves cannot be detected with spectrum analyzers or RF Fig-4: FSO system (1x1) 4: FSO system (1x1) dependency: FSO execution highly depends on the patterns of weather in the installation area because atmospheric situations like fog, rainfall, temperature, dust particles, atmospheric turbulence and smoke directly influence the availability and reliability of the Unlicensed Spectrum: RF signals face a major challenge of interference due to congestion of the RF spectrum. Local regulatory bodies like Office of Communication in the United Kingdom, National Communications Authority (NCA) in deral Communication Commission in the United States Telecommunications in India observe the use of the RF spectrum in their concerned countries. To use RF spectrum needs license from the local and and Department Department of of Fig-5: FSO system (2x2) 5: FSO system (2x2) @ IJTSRD | Available Online @ www.ijtsrd.com www.ijtsrd.com | Volume – 2 | Issue – 6 | Sep-Oct 2018 Oct 2018 Page: 649
International Journal of Trend in Scientific Research and Development (IJTSRD) ISSN: 2456 International Journal of Trend in Scientific Research and Development (IJTSRD) ISSN: 2456 International Journal of Trend in Scientific Research and Development (IJTSRD) ISSN: 2456-6470 Similarly 16x16 architecture is also designed to Similarly 16x16 architecture is also designed to perform the analysis. 4.SIMULATION ANALYSIS All FSO systems are simulated to determine the range possible for different input power at different atmospheric conditions for 1550nm frequency. In this analysis value of Q factor is maintained constant at 5.17 and minimum BER is 10 power under different climatic conditions are below: Table 1 Simulation results for different power at clear climate Attenuation = 0.43 dB/Km, Q and Minimum BER = 10 Maximum Possible Range Maximum Possible Range SIMULATION ANALYSIS All FSO systems are simulated to determine the range possible for different input power at different atmospheric conditions for 1550nm frequency. In this analysis value of Q factor is maintained constant at 5.17 and minimum BER is 10-7. Results for different power under different climatic conditions are shown Table 1 Simulation results for different power at clear climate Attenuation = 0.43 dB/Km, Q-Factor = 5.17 and Minimum BER = 10-7 Fig-6: FSO system (4x4) (Km) 15 dBm 45.88 50.82 56.05 61.13 Configuration 10 dBm 38.04 43.06 47.78 52.18 57.45 20 dBm 53.95 59.31 62.87 68.21 75.26 25 dBm 63.61 68.16 73.75 80.04 84.80 dBm 45.88 50.82 56.05 61.13 66.54 66.54 1x1 2x2 4x4 8x8 16x16 Fig-7: FSO system (8x8) Table 2 Simulation results for different power at haze climate Attenuation = 4.3 dB/Km, Q Attenuation = 4.3 dB/Km, Q-Factor = 5.17 and Minimum BER = 10 Maximum Possible Range (Km) 10 dBm 7.133 7.705 8.162 8.953 9.455 Table 2 Simulation results for different power at haze climate Factor = 5.17 and Minimum BER = 10-7 Configuration 15 dBm 8.021 8.573 9.059 9.805 10.429 20 dBm 8.911 9.621 10.206 10.662 11.310 25 dBm 9.941 10.541 11.255 11.814 25 dBm 9.941 10.541 11.255 11.814 12.439 12.439 1x1 2x2 4x4 8x8 16x16 Table 3 Simulation results for different power at fog Attenuation = 43 dB/Km, Q Attenuation = 43 dB/Km, Q-Factor = 5.17 and Minimum BER = 10 Maximum Possible Range (Km) 10 dBm 1.007 1.145 1.206 1.266 1.319 Table 3 Simulation results for different power at fog climate Factor = 5.17 and Minimum BER = 10-7 Configuration 15 dBm 1.180 1.253 1.301 1.376 1.436 20 dBm 1.293 1.351 1.395 1.458 1.528 25 dBm 1.391 1.452 1.512 1.567 25 dBm 1.391 1.452 1.512 1.567 1.632 1.632 1x1 2x2 4x4 8x8 16x16 @ IJTSRD | Available Online @ www.ijtsrd.com www.ijtsrd.com | Volume – 2 | Issue – 6 | Sep-Oct 2018 Oct 2018 Page: 650
International Journal of Trend in Scientific Research and Development (IJTSRD) ISSN: 2456 Scientific Research and Development (IJTSRD) ISSN: 2456 Scientific Research and Development (IJTSRD) ISSN: 2456-6470 Graphical representation of Table 1, 2 and 3 are shown below: Graphical representation of Table 1, 2 and 3 are Fig. 10 Comparison graph of range for different Fig. 10 Comparison graph of range for different power at fog climate power at fog climate As we increase the attenuation value range decreases as compared to other climatic conditions. 5.EYE DIAGRAM RESULTS In this section, eye diagrams for different values of attenuation at 10 dBm powers conditions for 1x1 type of configuration are shown. conditions for 1x1 type of configuration are shown. Fig. 8 Comparison graph of range for different power at clear climate From Fig. 8 we can conclude that as we increase the input power, optical range increases with increasing diversity. Range is above 80 Km for clear climate where attenuation is equal to 0.43 dB/Km. Similarly for other attenuation values comparison graphs are shown in Fig. 9 & 10. Fig. 8 Comparison graph of range for different power As we increase the attenuation value range decreases as compared to other climatic conditions. From Fig. 8 we can conclude that as we increase the input power, optical range increases with increasing diversity. Range is above 80 Km for clear climate where attenuation is equal to 0.43 dB/Km. Similarly for other attenuation values comparison graphs are EYE DIAGRAM RESULTS agrams for different values of powers under different climatic Fig 11 Eye diagram for 1x1 FSO at clear climate Fig 11 Eye diagram for 1x1 FSO at clear climate Fig. 9 Comparison graph of range for different power at haze climate f range for different power Fig 12 Eye diagram for 1x1 FSO at haze climate Fig 12 Eye diagram for 1x1 FSO at haze climate @ IJTSRD | Available Online @ www.ijtsrd.com www.ijtsrd.com | Volume – 2 | Issue – 6 | Sep-Oct 2018 Oct 2018 Page: 651
International Journal of Trend in Scientific Research and Development (IJTSRD) ISSN: 2456 International Journal of Trend in Scientific Research and Development (IJTSRD) ISSN: 2456 International Journal of Trend in Scientific Research and Development (IJTSRD) ISSN: 2456-6470 3.S. A. Al-Gailani, A. B. Mohammad, and R. Q. Shaddad, “Enhancement of free space optical link in heavy rain attenuation using multiple beam concept,” Optik,vol.124,no.21, 2013. 4.Z. Ghassemlooy, J. Perez, and performance of FSO communications links under sandstorm conditions,” International Conference on Telecommunications, IEEE, June 2013. 5.K. Rammprasath and S. Prince, “Analyzing the cloud attenuation on the performance of free space optical communication,” International Conference on Communication and Signal Processing, 2013. 6.S. A. Al-Gailani, A. B. Mohammad, R. Q. Shaddad, and M. Y. Jamaludin, “Single and multiple transceiver simulation modules for free space optical channel in tropical ma weather,” IEEE Business Engineering and Industrial Applications Colloquium, April 2013. 7.H. A.Willebrand and B.S.Ghuman, “Fiber optics without fiber,” IEEE Spectrum, 2001. 8.V. Sharma and G. Kaur, “High speed, long reach OFDM-FSO transmission link inc OSSB and OTSB schemes,” Optik, 2013. 9.R. K. Z. Sahbudin, M. Kamarulzaman, S. Hitam, M. Mokhtar, and S.B.A.Anas, “Performance of SAC OCDMA-FSO communication systems,” Optik, 2013. 10.Manisha Prajapat and Chetan Selwal, “Free Space Optical Link Performance Simulation under Different Atmospheric Conditions and Diversity”, IEEE, 2017. Gailani, A. B. Mohammad, and R. Q. Shaddad, “Enhancement of free space optical link in heavy rain attenuation using multiple beam concept,” Optik,vol.124,no.21, 2013. Perez, and E. Leitgeb, “On the performance of FSO communications links under sandstorm conditions,” International Conference on Telecommunications, IEEE, June 2013. K. Rammprasath and S. Prince, “Analyzing the cloud attenuation on the performance of free space l communication,” International Conference on Communication and Signal Processing, 2013. Fig 13 Eye diagram for 1x1 FSO at fog climate for 1x1 FSO at fog climate Gailani, A. B. Mohammad, R. Q. Shaddad, and M. Y. Jamaludin, “Single and multiple transceiver simulation modules for free- space optical channel in tropical malaysian weather,” IEEE Business Engineering and Industrial Applications Colloquium, April 2013. 6. CONCLUSIONS FSO provides several benefits over previously developed methods in optical, radio or microwave domain. Less installation cost and less installation time are the main benefits of FSO system. In FSO system atmospheric conditions such as haze, fog and so on is the main factor which causes distortion in optical signal. We have successfully analyzed different configurations of FSO system and calculated range at different power under the influence of different climatic conditions. REFERENCES 1.S. Vigneshwaran, I.Muthumani, and A. S. Raja, “Investigations on communication system,” International Conference on Information Communication & Embedded Systems, IEEE, 2013. 2.J. Singh and N. Kumar, “Performance analysis of diferent modulation format on free communication system,” Optik, 2013. communication system,” Optik, 2013. FSO provides several benefits over previously developed methods in optical, radio or microwave domain. Less installation cost and less installation time are the main benefits of FSO system. In FSO system atmospheric conditions such as haze, fog and s the main factor which causes distortion in optical signal. We have successfully analyzed different configurations of FSO system and calculated range at different power under the influence of A.Willebrand and B.S.Ghuman, “Fiber optics without fiber,” IEEE Spectrum, 2001. V. Sharma and G. Kaur, “High speed, long reach FSO transmission link incorporating OSSB and OTSB schemes,” Optik, 2013. R. K. Z. Sahbudin, M. Kamarulzaman, S. Hitam, M. Mokhtar, and S.B.A.Anas, “Performance of FSO communication systems,” Muthumani, and A. S. Raja, on “Investigations communication system,” International Conference on Information Communication & Embedded free free space space optics optics Manisha Prajapat and Chetan Selwal, “Free Space mance Simulation under Different Atmospheric Conditions and Diversity”, J. Singh and N. Kumar, “Performance analysis of diferent modulation format on free space optical @ IJTSRD | Available Online @ www.ijtsrd.com www.ijtsrd.com | Volume – 2 | Issue – 6 | Sep-Oct 2018 Oct 2018 Page: 652