Download
1 / 7
70 likes | 92 Views
In this work, review of various well known algorithms for image denoising is carried out and their performances with their methodologies are comparatively assessed. A new algorithm based on the orthonormal wavelet transform OWT is developed. In this work images corrupted by AWGN are denoised. Simulation results shows that proposed method using Orthonormal wavelets for different values of noise Standard Deviation s in dB outperforms other available methods. Also Coiflet Wavelet performs better than Symlet, Haar and Daubechies wavelets. The proposed Orthonormal wavelet transform OWT method has minimum Mean Square and highest PSNR with Coif let wavelets. Simulation results shows that denoised image is 98.29 similar for 5 dB noise standard deviation and 84.42 similar for 30 dB noise standard deviation. The proposed method has 1.35 dB and 4 improvement for s =10 dB, 2.08 dB and 7 improvement for s =20 dB and 2.26 dB and 9 improvement for s =30 dB as compared to denoising with two thresholds for edge detection 1 . Shruti Badgainya | Prof. Pankaj Sahu | Prof. Vipul Awasthi "Image Denoising for AWGN Corrupted Image Using OWT & Thresholding" Published in International Journal of Trend in Scientific Research and Development (ijtsrd), ISSN: 2456-6470, Volume-2 | Issue-6 , October 2018, URL: https://www.ijtsrd.com/papers/ijtsrd18338.pdf Paper URL: http://www.ijtsrd.com/engineering/electronics-and-communication-engineering/18338/image-denoising-for-awgn-corrupted-image-using-owt-and-thresholding/shruti-badgainya<br>

E N D
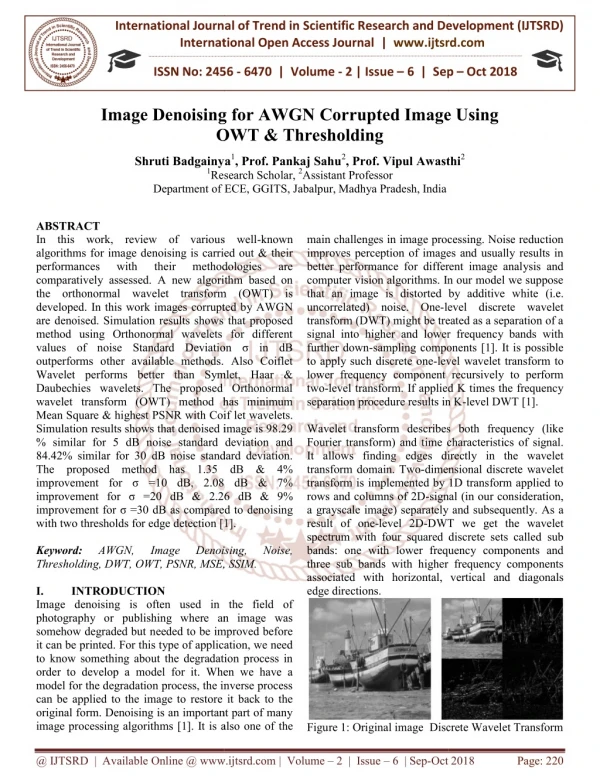
International Journal of Trend in International Open Access Journal International Open Access Journal | www.ijtsrd.com International Journal of Trend in Scientific Research and Development (IJTSRD) Research and Development (IJTSRD) www.ijtsrd.com ISSN No: 2456 ISSN No: 2456 - 6470 | Volume - 2 | Issue – 6 | Sep 6 | Sep – Oct 2018 Image Denoising for AWGN Image Denoising for AWGN Corrupted Image Using OWT & Thresholding Corrupted Image Using OWT & Thresholding Shruti Badgainy Shruti Badgainya1, Prof. Pankaj Sahu2, Prof. Vipul Awasthi Research Scholar, 2Assistant Professor of ECE, GGITS, Jabalpur,Madhya Pradesh,India Vipul Awasthi2 1Research Scho Department of ABSTRACT In this work, review of various well algorithms for image denoising is carried out & their performances with their comparatively assessed. A new algorithm based on the orthonormal wavelet transform (OWT) is developed. In this work images corrupted by AWGN are denoised. Simulation results shows that proposed method using Orthonormal wavelets for different values of noise Standard Deviation σ in dB outperforms other available methods. Also Coiflet Wavelet performs better than Symlet, Haar & Daubechies wavelets. The proposed Orthonormal wavelet transform (OWT) method has minimum Mean Square & highest PSNR with Coif let Simulation results shows that denoised image is 98.29 % similar for 5 dB noise standard deviation and 84.42% similar for 30 dB noise standard deviation. The proposed method has 1.35 dB & 4% improvement for σ =10 dB, 2.08 dB & 7% improvement for σ =20 dB & 2.26 dB & 9% improvement for σ =30 dB as compared to denoising with two thresholds for edge detection [1]. Keyword: AWGN, Image Thresholding, DWT, OWT, PSNR, MSE, SSIM. I. INTRODUCTION Image denoising is often used in the field of photography or publishing where an image was somehow degraded but needed to be improved before it can be printed. For this type of application, we need to know something about the degradation process in order to develop a model for it. When we have a model for the degradation process, the inverse process can be applied to the image to restore it back to the original form. Denoising is an important part of many image processing algorithms [1]. It is also one of image processing algorithms [1]. It is also one of the main challenges in image processing. Noise reduction improves perception of images and usually results in better performance for different image analysis and computer vision algorithms. In our model we suppose that an image is distorted by additive w uncorrelated) noise. One-level discrete wavelet transform (DWT) might be treated as a separation of a signal into higher and lower frequency bands with further down-sampling components [1]. It is possible to apply such discrete one-level wavelet lower frequency component recursively to perform two-level transform. If applied K times the frequency separation procedure results in K Wavelet transform describes both frequency (like Fourier transform) and time characterist It allows finding edges directly in the wavelet transform domain. Two-dimensional discrete wavelet transform is implemented by 1D transform applied to rows and columns of 2D-signal (in our consideration, a grayscale image) separately and sub result of one-level 2D-DWT we get the wavelet spectrum with four squared discrete sets called bands: one with lower frequency components and three sub bands with higher frequency components associated with horizontal, vertical and edge directions. In this work, review of various well-known algorithms for image denoising is carried out & their performances with their comparatively assessed. A new algorithm based on the orthonormal wavelet transform (OWT) is developed. In this work images corrupted by AWGN are denoised. Simulation results shows that proposed method using Orthonormal wavelets for different se Standard Deviation σ in dB outperforms other available methods. Also Coiflet Wavelet performs better than Symlet, Haar & Daubechies wavelets. The proposed Orthonormal wavelet transform (OWT) method has minimum main challenges in image processing. Noise reduction improves perception of images and usually results in better performance for different image analysis and computer vision algorithms. In our model we suppose that an image is distorted by additive white (i.e. methodologies methodologies are are level discrete wavelet transform (DWT) might be treated as a separation of a signal into higher and lower frequency bands with sampling components [1]. It is possible level wavelet transform to lower frequency component recursively to perform level transform. If applied K times the frequency separation procedure results in K-level DWT [1]. Coif let wavelets. Simulation results shows that denoised image is 98.29 % similar for 5 dB noise standard deviation and 84.42% similar for 30 dB noise standard deviation. The proposed method has 1.35 dB & 4% improvement for σ =10 dB, 2.08 dB & 7% 20 dB & 2.26 dB & 9% improvement for σ =30 dB as compared to denoising with two thresholds for edge detection [1]. Wavelet transform describes both frequency (like Fourier transform) and time characteristics of signal. edges directly in the wavelet dimensional discrete wavelet transform is implemented by 1D transform applied to signal (in our consideration, a grayscale image) separately and subsequently. As a DWT we get the wavelet spectrum with four squared discrete sets called sub s: one with lower frequency components and s with higher frequency components associated with horizontal, vertical and diagonals AWGN, Image Denoising, Denoising, Noise, Noise, Thresholding, DWT, OWT, PSNR, MSE, SSIM. Image denoising is often used in the field of photography or publishing where an image was somehow degraded but needed to be improved before it can be printed. For this type of application, we need to know something about the degradation process in o develop a model for it. When we have a model for the degradation process, the inverse process can be applied to the image to restore it back to the original form. Denoising is an important part of many Figure 1: Original image Discrete Wavelet Transform Discrete Wavelet Transform @ IJTSRD | Available Online @ www.ijtsrd.com www.ijtsrd.com | Volume – 2 | Issue – 6 | Sep-Oct 2018 Oct 2018 Page: 220
International Journal of Trend in Scientific Research and Development (IJTSRD) ISSN: 2456 International Journal of Trend in Scientific Research and Development (IJTSRD) ISSN: 2456 International Journal of Trend in Scientific Research and Development (IJTSRD) ISSN: 2456-6470 II. Wavelets are mathematical functions that analyze data according to scale or Resolution. They aid in studying a signal in different windows or resolutions. For instance, if the signal is viewed in a large window, gross features can be noticed, but if viewed in a small window, only small features can be noticed. Wavelets provide some advantages over Fourier transforms. For example, they do a good job in approximating signals with sharp spikes or signals having discontinuities. Wavelets can also model speech, music, video and non-stationary stochastic signals. Wavelets can be used in applications such as image compression, turbulence, human vision, radar, earthquake prediction, etc. The term “wavelets” is used to refer to a set of Ortho-normal basis functions generated by dilation and translation of scaling function φ and a mother wavelet ψ. The finite scale multi resolution representation of a discrete function can be called as a discrete wavelet transform. DWT is a fast linear operation on a data vector, whose length is an integer power of 2. This transform is invertible and orthogonal, where the inverse transform expressed as a matrix is the transpose of the transform matrix. The wavelet basis or function, unlike sine and cosines as in Fourier transform, is quite localized in space. But similar to sine and cosines, individual wavelet functions are localized in frequency. The Ortho-normal basis or wavelet basis is defined as: al basis or wavelet basis is defined as: Discrete Wavelet Transform (DWT) Discrete Wavelet Transform (DWT) Wavelets are mathematical functions that analyze data according to scale or Resolution. They aid in studying at different resolutions. For instance, if the signal is viewed in a large window, gross features can be noticed, but if viewed in a small window, only small features can be noticed. Wavelets provide some advantages over hey do a good job in approximating signals with sharp spikes or signals having discontinuities. Wavelets can also model stationary stochastic signals. Wavelets can be used in applications such as human vision, radar, earthquake prediction, etc. The term “wavelets” is normal basis functions generated by dilation and translation of scaling function φ and a mother wavelet ψ. The finite scale ion of a discrete function can be called as a discrete wavelet transform. DWT is a fast linear operation on a data vector, whose length is an integer power of 2. This transform is invertible and orthogonal, where the inverse transform is the transpose of the transform matrix. The wavelet basis or function, unlike sine and cosines as in Fourier transform, is quite localized in space. But similar to sine and cosines, individual wavelet functions are localized in frequency. The Figure 2: A 1-Dimensional DWT Dimensional DWT - Decomposition step The scaling function is given as: Where ψ is called the wavelet function and j and k are integers that scale and dilate the wavelet function. The factor „j‟ is known as the scale index, which indicates the wavelet‟s width. The location index k provides the position. The wavelet function is dilated by powers of two and is translated by the integer k. In terms of the wavelet coefficients, the wavelet equation is Where ψ is called the wavelet function and j and k are integers that scale and dilate the wavelet function. The ‟ is known as the scale index, which indicates ‟s width. The location index k provides the position. The wavelet function is dilated by powers of two and is translated by the integer k. In terms of the wavelet coefficients, the wavelet equation Figure 3: One level wavelet decomposition of two dimensional data Figure 3: One level wavelet decomposition of two dimensional data Where, g0, g1, g2 are high pass wavelet coeff Writing the scaling equation in terms of the scaling coefficients as given below, we get; Where, g0, g1, g2 are high pass wavelet coefficients. Writing the scaling equation in terms of the scaling Figure 4: Sub bands in wavelet bands in wavelet decomposition of two dimensional data dimensional data @ IJTSRD | Available Online @ www.ijtsrd.com www.ijtsrd.com | Volume – 2 | Issue – 6 | Sep-Oct 2018 Oct 2018 Page: 221
International Journal of Trend in Scientific Research and Development (IJTSRD) ISSN: 2456 International Journal of Trend in Scientific Research and Development (IJTSRD) ISSN: 2456 International Journal of Trend in Scientific Research and Development (IJTSRD) ISSN: 2456-6470 DWT is the multi resolution description of an image. The decoding can be processed sequentially from a low resolution to the higher resolution. DWT splits the signal into high and low frequency parts. The high frequency part contains information about the edge components, while the low frequency part is split again into high and low frequency parts. The high frequency components watermarking since the human eye is less sensitive to changes in edges. In two dimensional applications, for each level of decomposition, we first perform the DWT in the vertical direction, followed by the DWT in the horizontal direction. After the first level of decomposition, there are 4 sub-bands: LL1, LH1, HL1, and HH1. For each successive level of decomposition, the LL Sub-band of the previous level is used as the input. To perform second level decomposition, the DWT is applied to LL1 band which decomposes the LL1 band into the four sub bands LL2, LH2, HL2, and HH2. To perform third level decomposition, the DWT is applied to LL2 band which decompose this band into the four sub-bands – LL3, LH3, HL3, HH3. This results in 10 sub-bands per component. LH1, HL1, and HH1 contain the highest frequency bands present in the image tile, while LL3 contains the lowest frequency band. DWT is currently used in a wide variety of signal processing applications, such as in audio and video compression, removal of noise in audio, and the simulation of wireless antenna distribution. simulation of wireless antenna distribution. DWT is the multi resolution description of an image. The decoding can be processed sequentially from a low resolution to the higher resolution. DWT splits the signal into high and low frequency parts. The high y part contains information about the edge components, while the low frequency part is split again into high and low frequency parts. The high frequency components watermarking since the human eye is less sensitive to In two dimensional applications, for each level of decomposition, we first perform the DWT in the vertical direction, followed by the DWT in the horizontal direction. After the first level of Table 1: Wavelet families and their properties Table 1: Wavelet families and their properties are are usually usually used used for for The term wavelet thresholding is explained as decomposition of the data or the image into wavelet coefficients, comparing the detail coefficients with a given threshold value, and shrinking these coefficients close to zero to take away the effect of noise in the data. The image is reconstructed from the modified coefficients. This process is also known as the inverse discrete wavelet transform. During thresholding, a wavelet coefficient is compared with a given threshold and is set to zero if its magnitude is less than the threshold; otherwise, it is retained or modified depending on Thresholding distinguishes between the coefficients due to noise and the ones con signal information. Wavelet Denoising There are many techniques for image denoising which are using wavelet & based on wavelet shrinkage & wavelet thresholding. The computational advantage of using such estimation approaches is prov algorithms of fast implementation. The smaller coefficients are instead eliminated, hence sparsifying the wavelet expansion. The simplest model of Image Degradation/Restoration Process: Degradation/Restoration Process: The term wavelet thresholding is explained as decomposition of the data or the image into wavelet coefficients, comparing the detail coefficients with a shrinking these coefficients close to zero to take away the effect of noise in the data. The image is reconstructed from the modified coefficients. This process is also known as the inverse discrete wavelet transform. During thresholding, a ient is compared with a given threshold and is set to zero if its magnitude is less than the threshold; otherwise, it is retained or modified depending on Thresholding distinguishes between the coefficients due to noise and the ones consisting of important bands: LL1, LH1, or each successive level of band of the previous level is used as the input. To perform second level decomposition, the DWT is applied to LL1 band which decomposes the LL1 band into the four sub- the the threshold threshold rule. rule. To perform third level decomposition, the DWT is applied to LL2 band which decompose this band into LL3, LH3, HL3, HH3. This bands per component. LH1, HL1, and HH1 contain the highest frequency bands present age tile, while LL3 contains the lowest There are many techniques for image denoising which are using wavelet & based on wavelet shrinkage & wavelet thresholding. The computational advantage of using such estimation approaches is provided by algorithms of fast implementation. The smaller coefficients are instead eliminated, hence sparsifying the wavelet expansion. The simplest model of Image DWT is currently used in a wide variety of signal processing applications, such as in audio and video compression, removal of noise in audio, and the Figure 5: 3level discrete wavelet decomposition level discrete wavelet decomposition Figure 6: Model of the image degradation/restoration Figure 6: Model of the image degradation/restoration process process Wavelets have their energy concentrated in time and are well suited for the analysis of transient, time varying signals. Since most of the real life signals encountered are time varying in nature, the Wavele Transform suits many applications very well. As mentioned earlier, the wavelet equation produces different wavelet families like Daubechies, Haar, Coiflets, etc. The filter lengths and the number of vanishing moments for four different wavelet families are tabulated in Table 1. Wavelets have their energy concentrated in time and are well suited for the analysis of transient, time- varying signals. Since most of the real life signals encountered are time varying in nature, the Wavelet Transform suits many applications very well. As mentioned earlier, the wavelet equation produces different wavelet families like Daubechies, Haar, Coiflets, etc. The filter lengths and the number of vanishing moments for four different wavelet families Wavelets provide a good expansion basis for the unknown function, because it can satisfy both parsimony & sparsity properties simultaneously; while the latter comes front the inherent distribution of the "energy" of the function over the coefficient vector, hence naturally selecting a subset of them as the most significant. This thesis work involves the denoising of intensity images with formats like JPG. Bto.1P. PNG & TIF[7]. Wavelets provide a good expansion basis for the unknown function, because it can satisfy both parsimony & sparsity properties simultaneously; while the latter comes front the inherent distribution of the "energy" of the function over the coefficient or, hence naturally selecting a subset of them as the most significant. This thesis work involves the denoising of intensity images with formats like JPG. @ IJTSRD | Available Online @ www.ijtsrd.com www.ijtsrd.com | Volume – 2 | Issue – 6 | Sep-Oct 2018 Oct 2018 Page: 222
International Journal of Trend in Scientific Research and Development (IJTSRD) ISSN: 2456 International Journal of Trend in Scientific Research and Development (IJTSRD) ISSN: 2456 International Journal of Trend in Scientific Research and Development (IJTSRD) ISSN: 2456-6470 One of the most important properties of wavelets is that they provide unconditional bases for many other different signal classes. Hence, most of the signal information in wavelet expansions is conveyed by a relatively small number of large coefficients. The process of denoising using wavelets has been described by [14] & called “Wavelet Shrinkage”. In many systems, the concept of additive white Gaussian noise (AWGN) is used. This simply means a noise, which has a Gaussian probability density function & white power spectral density function (noise distributed over the entire frequency spectrum) & is linearly added to whatever signal used for analyzing. This work focuses primarily on thresholding as a means of denoising in the wavelet-domain due to some important characteristics present in wavelet coefficients. The noisy input signal can be thought of as the sum of the desired signal component (or true signal) & the additive white Gaussian noise (AWGN) with variance of ??& is shown in equation below. ?(?,?) = ?(?,?) + ?? ?(? Where; f (?,?) is desired signal & n ( component. It has been shown that when the wavelet basis selected, matches well with the signal characteristics, a very few of the wavelet detail coefficients are influenced by the signal, while most of them are influenced by the noise. Therefore, an expression for the wavelet coefficients at each decomposition level can be described by the equation given as: ??= ??(?) + ??(?) In addition, the desired signal coefficients a expected to be of larger magnitude when the SNR is not too small. Therefore, denoising is accomplished by thresholding wavelet eliminating noise-only coefficients & keeping the desired signal coefficients for reconstruction. III. PROPOSED METHODOLOGY In this part of the paper a detailed stepwise procedure is mentioned which is followed while denoising images using Orthonormal wavelets basis with eight vanishing moments (sym8) over four decomposition stages. The wavelet coefficients that lie on the same dyadic tree are well known to be large together in the neighborhood of image discontinuities. What can, neighborhood of image discontinuities. What can, One of the most important properties of wavelets is thus, be predicted with reasonably good accuracy are the position of large wavelet coefficients out of thus, be predicted with reasonably good accuracy are the position of large wavelet coefficients out of parents at lower resolutions. However, getting the actual values of the finer resolution scale coefficients seem somewhat out of reach. This suggests that the best we can get out of between segmentation between regions of large and small coefficients. In critically wavelet decomposition, the parent size of the child sub band. The usual way of putting the two sub bands in correspondence is simply to expand the parent by a factor two. Unfortunately, this approach does not take into account the potential non integer shift caused by the filters of the DWT. We, thus, propose a more sophisticated solution, which addresses this issue and ensures the alignment of image features between the child and its parent. This idea comes from the following observation: Let ???and ???be, respectively, band pass and low pass outputs at iteration of the filter bank. Then, if the group delay between the bandpass and the low pass filters are equal, no shift between the features of Let ???and ???will occur. Of course, depending on the amplitude response of the filters, some features may be attenuated, blurred, or enhanced, but their location will remain unchanged. When the group delays differ, which is the general case, we, thus, pr the low pass sub band ??? in order to compensate for the group delay difference with the three bandpass “directions” by adequately designed filters ???,???& i.e., group delay compensated, ???, ??? & ???. Wavelet transform is appropriate for the digital image denoising methods. Because it can be transforming the images into sub one contains certain frequencies that analyzed and processed easily [3]. For better & easy understanding, a complete flowchart of the discussed methodology has been shown at the end of this chapter. The proposed algorithm steps are as follows: onal bases for many other different signal classes. Hence, most of the signal information in wavelet expansions is conveyed by a relatively small number of large coefficients. The process of denoising using wavelets has been ns. However, getting the actual values of the finer resolution scale coefficients seem somewhat out of reach. This suggests that the best we can get out of between-scale correlations is between regions of large and small elet Shrinkage”. In many systems, the concept of additive white Gaussian noise (AWGN) is used. This simply means a noise, which has a Gaussian probability density function & white power spectral density function (noise sampled orthonormal wavelet decomposition, the parent sub band is half the . The usual way of putting bands in correspondence is simply to expand the parent by a factor two. Unfortunately, this take into account the potential non- integer shift caused by the filters of the DWT. We, thus, propose a more sophisticated solution, which addresses this issue and ensures the alignment of image features between the child and its parent. This om the following observation: Let be, respectively, band pass and low pass outputs at iteration of the filter bank. Then, if the group delay between the bandpass and the low pass filters are equal, no shift between the features of Let will occur. Of course, depending on the amplitude response of the filters, some features may be attenuated, blurred, or enhanced, but their location will remain unchanged. When the group delays differ, which is the general case, we, thus, propose to filter in order to compensate for the group delay difference with ???. ???is filtered in the three bandpass “directions” by adequately spectrum) & is linearly added to whatever signal used for analyzing. This work focuses primarily on thresholding as a domain due to some important characteristics present in wavelet The noisy input signal can be thought of as the sum of the desired signal component (or true signal) & the additive white Gaussian noise (AWGN) with variance ?,?) esired signal & n (?,?) is noisy component. It has been shown that when the wavelet basis selected, matches well with the signal characteristics, a very few of the wavelet detail coefficients are influenced by the signal, while most d by the noise. Therefore, an expression for the wavelet coefficients at each decomposition level can be described by the equation & ???providing aligned, compensated, sub bands with . Wavelet transform is appropriate for the digital image denoising methods. Because it can be transforming the images into sub-bands, each one contains certain frequencies that analyzed and ………(3.3) In addition, the desired signal coefficients are expected to be of larger magnitude when the SNR is not too small. Therefore, denoising is accomplished by thresholding wavelet only coefficients & keeping the desired signal coefficients for reconstruction. For better & easy understanding, a complete flowchart of the discussed methodology has been shown at the end of this chapter. The proposed algorithm steps are coefficients, coefficients, thereby thereby PROPOSED METHODOLOGY In this part of the paper a detailed stepwise procedure is mentioned which is followed while denoising images using Orthonormal wavelets basis with eight vanishing moments (sym8) over four decomposition s that lie on the same are well known to be large together in the @ IJTSRD | Available Online @ www.ijtsrd.com www.ijtsrd.com | Volume – 2 | Issue – 6 | Sep-Oct 2018 Oct 2018 Page: 223
International Journal of Trend in Scientific Research and Development (IJTSRD) ISSN: 2456 International Journal of Trend in Scientific Research and Development (IJTSRD) ISSN: 2456 International Journal of Trend in Scientific Research and Development (IJTSRD) ISSN: 2456-6470 ???????? ???? ???? = 10.∗ ????? Where I and K are the original and noisy / denoised image, respectively. ???? value of the image under test. For an image having 8 bits per sample, pixels representation, this is equivalent to 2?= 255. In simulation we have done the simulations with Orthonormal wavelets basis with eight vanishing moments (sym8) over four decomposition stages. Standard test image ‘Boat’ is taken for verification of our proposed algorithm. We have performed simulations for AWGN for a range dB. Where I and K are the original and noisy / denoised is the maximum pixel value of the image under test. For an image having 8 bits per sample, pixels representation, this is have done the simulations with Orthonormal wavelets basis with eight vanishing moments (sym8) over four decomposition stages. Standard test image ‘Boat’ is taken for verification of our proposed algorithm. We have performed simulations for AWGN for a range from 5 dB to 30 Figure 8: Test image ‘Boat proposed method using ‘Coiflet’ wavelet at 5 dB AWGN noise Figure 8: Test image ‘Boat proposed method using ‘Coiflet’ wavelet at 5 dB AWGN noise Figure 9: Test image ‘Boat’ proposed method using ‘Coiflet’ wavelet at 10 dB AWGN noise Figure 9: Test image ‘Boat’ proposed method using ‘Coiflet’ wavelet at 10 dB AWGN noise Figure 7: Proposed Denoising Algorithm Figure 7: Proposed Denoising Algorithm IV. SIMULATION DISCUSSIONS PSNR is calculated for all the standard images with their noisy and denoised image counterparts, respectively. Hence I get good amount of comparison between the noisy and denoised image keeping the set standard image intact. PSNR stands for the peak signal to noise ratio. It is a term used to calculate the ratio of the maximum power of a test signal and the power of noise corrupted version of the test signal. Since most of the signals have a large dynamic range, PSNR is generally represented in terms of the logarithmic decibel (dB) scale. It is most commonly used as a measure of quality of reconstruction in image compression etc. It is calculated as the following: 1 ??? ??? ??? SIMULATION RESULTS RESULTS & & PSNR is calculated for all the standard images with their noisy and denoised image counterparts, respectively. Hence I get good amount of comparison between the noisy and denoised image keeping the set Figure 10: Test image ‘Boat proposed method using Figure 10: Test image ‘Boat proposed method using ‘Coiflet’ wavelet at 15 dB AWGN noise ‘Coiflet’ wavelet at 15 dB AWGN noise e peak signal to noise ratio. It is a term used to calculate the ratio of the maximum power of a test signal and the power of noise corrupted version of the test signal. Since most of the signals have a large dynamic range, PSNR is terms of the logarithmic decibel (dB) scale. It is most commonly used as a measure of quality of reconstruction in image compression etc. It is calculated as the following: Figure 11: Test image ‘Boat’ proposed method using ‘Coiflet’ wavelet at 20 dB AWGN noise Figure 11: Test image ‘Boat’ proposed method using ‘Coiflet’ wavelet at 20 dB AWGN noise ??? ??? Figure 12: Test image ‘Boat’ proposed method using Figure 12: Test image ‘Boat’ proposed method using ‘Coiflet’ wavelet at 25 dB AWGN noise ‘Coiflet’ wavelet at 25 dB AWGN noise ) − ?(?,?)‖? ‖?(?,?) − ??? = ? @ IJTSRD | Available Online @ www.ijtsrd.com www.ijtsrd.com | Volume – 2 | Issue – 6 | Sep-Oct 2018 Oct 2018 Page: 224
International Journal of Trend in Scientific Research and Development (IJTSRD) ISSN: 2456 International Journal of Trend in Scientific Research and Development (IJTSRD) ISSN: 2456 International Journal of Trend in Scientific Research and Development (IJTSRD) ISSN: 2456-6470 SIMULATION RESULTS COMPARISON In Image Denoising Using Discrete Wavelet Transform and Edge Information [1], denoising with two different methods has been performed for various test images. A comparison for standard ‘Boat’ image IV.3 SIMULATION RESULTS C In Image Denoising Using Discrete Wavelet Transform and Edge Information [1], denoising with two different methods has been test images. A comparison for standard ‘Boat’ image is listed in table 3. Figure 13: Test image ‘Boat’ proposed method using ‘Coiflet’ wavelet at 30 dB AWGN noise ‘Coiflet’ wavelet at 30 dB AWGN noise osed method using IV.2 SIMULATION RESULTS SUMMARY In simulation we have taken Symlet, Coifilet etc orthogonal wavelets. The summary of experiments using proposed method is listed in table 2. using proposed method is listed in table 2. SIMULATION RESULTS SUMMARY In simulation we have taken Symlet, Coifilet etc orthogonal wavelets. The summary of experiments Table 3: Test Image Boat Simulation Results Table 3: Test Image Boat Simulatio Comparison Comparison Table 2: Test Image ‘Boat’ Simulation Results ‘Boat’ Simulation Results Figure 17: PSNR comparison graph for test image Figure 17: PSNR comparison graph for test image ‘Boat’ ‘Boat’ Figure 14: PSNR comparison for test image ‘Boat’ Figure 14: PSNR comparison for test image ‘Boat’ V. In this paper image denoising techniques for the AWGN corrupted has been given. A new algorithm based on the orthonormal wavelet transform (OWT) is developed. In this work images corrupted by AWGN are denoised. Simulation results shows that proposed method using Orthonormal wavelets for different values of noise Standard Deviation σ in dB outperforms other available methods. Also Coiflet Wavelet performs better th Daubechies wavelets. The proposed Orthonormal wavelet transform (OWT) method has minimum Mean Square & highest PSNR with Coiflet wavelets. Simulation results shows that denoised image is 98.29 % similar for 5 dB noise standard deviation a 84.42% similar for 30 dB noise standard deviation. The proposed method has 1.35 dB & 4% improvement for σ =10 dB, 2.08 dB & 7% improvement for σ =20 dB & 2.26 dB & 9% improvement for σ =30 dB as compared to denoising with two thresholds for edge detecti with two thresholds for edge detection [1]. CONCLUSION In this paper image denoising techniques for the AWGN corrupted has been given. A new algorithm based on the orthonormal wavelet transform (OWT) is this work images corrupted by AWGN are denoised. Simulation results shows that proposed method using Orthonormal wavelets for different values of noise Standard Deviation σ in dB outperforms other available methods. Also Coiflet Wavelet performs better than Symlet, Haar & Daubechies wavelets. The proposed Orthonormal wavelet transform (OWT) method has minimum Mean Square & highest PSNR with Coiflet wavelets. Simulation results shows that denoised image is 98.29 % similar for 5 dB noise standard deviation and 84.42% similar for 30 dB noise standard deviation. The proposed method has 1.35 dB & 4% improvement for σ =10 dB, 2.08 dB & 7% improvement for σ =20 dB & 2.26 dB & 9% improvement for σ =30 dB as compared to denoising Figure 15: MSE comparison for test image ‘Boat’ Figure 15: MSE comparison for test image ‘Boat’ Figure 16: SSIM using Proposed method by Coiflet Wavelet for test image ‘Boat’ Wavelet for test image ‘Boat’ Figure 16: SSIM using Proposed method by Coiflet @ IJTSRD | Available Online @ www.ijtsrd.com www.ijtsrd.com | Volume – 2 | Issue – 6 | Sep-Oct 2018 Oct 2018 Page: 225
International Journal of Trend in Scientific Research and Development (IJTSRD) ISSN: 2456 International Journal of Trend in Scientific Research and Development (IJTSRD) ISSN: 2456 International Journal of Trend in Scientific Research and Development (IJTSRD) ISSN: 2456-6470 13.Dai, L., Zhang, Y., Li, Y.: Ima BM3D combining tetrolet prefiltering. Inf. Technol. J. 12(10), 1995–2001, 2013. 14.He, K., Sun, J., Tang, X.: Guided image filtering. In: Proceedings European Computer Vision, pp. 1–14, 2010. 15.Porikli, F, “Constant time O(1) bi In Proceeding IEEE Conference on Computer Vision and Pattern Recognition, Anchorage, pp. 1–8, 2008. 16.Yang, Q., Tan, K. H., Ahuja, N, “Real bilateral filtering”, Conference on Computer Vision and Pattern Recognition, Miami, pp. 557 17.Farbman, Z., Fattal, R., Lischinski, D., Szeliski, “R.: Edge-preserving decompositions for multi scale tone and detail manipulation”, ACM Transactions on Graphics 27(3), 1 18.Paris, S., Durand, F, “A fast bilateral filter using signal processing approach”, In the Proceeding of European Conference on Computer Vision, pp. 568– 19.Gonzalez, R. C., Woods, R. processing, 3rd edn. Prentice River, 2008. 20.Blu, T., Luisier, F, “The SURE image denoising”, IEEE Transaction Image Processing, 16(11), 2778–2786, 2007. 21.Paris, S., Durand, F.: A fast approximation of the bilateral filter using signal processing approach. In: Proceeding European C Vision, pp. 568–580, 2006. 22.Dabov, K., Foi, A., Katkovnik, V., Egiazarian, K.: Image denoising with block filtering. In: SPIE electronic imaging: algorithms and systems, vol. 6064, pp. 606414 2006. 23.Yuan, X., Buckles, B.: Sub band for adaptive wavelet shrinkage. In: Proceeding 17th International Conference Recognition, vol. 4, pp 885 24.Elad, M.: On the origin of the bilateral filter and ways to improve it. IEEE Transaction Processing, 11(10), 1141–1151, 2002. 25.Sendur, L., Selesnick, I. W.: Bivariate shrinkage functions for wavelet-based denoising exploiting interscale dependency. IEEE Trans. Signal Process. 50(11), 2744–2756, 2002. 26.Chang, S., Yu, B., Vetterli, M.: Spat wavelet thresholding based on context modeling for image denoising. IEEE Trans. Image Process. 9(9), 1522–1531, 2000. Dai, L., Zhang, Y., Li, Y.: Image denoising using BM3D combining tetrolet prefiltering. Inf. REFERENCES 1.Maxim Kimlyk et-al, “Image Denoising Using Discrete Wavelet Information”, IEEE Conference of Russian Young Researchers in Electrical Engineering (EIConRus), 2018. 2.S. Routray et-al, “A Novel Study on Color Image Denoising and Comparison of Various State the-art Methods”, IEEE International Conference on Trends in Electronics and Informatics (ICEI) 2017. 3.S. H. Ismael et-al, “A New Approach of Image Denoising Based Transform”, IEEE World Computer Applications & Research, 2016. 4.Liqiang Shi, “An Improved Image Denoising Algorithm”, Seventh Conference on Measuring Technology and Mechatronics Automation, 2015. 5.Wangmeng Zuo et-al, “Gradient Histogram Estimation and Preservation for Texture Enhanced Image Denoising”, IEEE Transactions on Image Processing, Volume 23, Number 6, June 2014. 6.Twinkle Shah et-al, “Epitome based Transform domain Image Denoising”, Published in IEEE, IET Image Processing Magazine, Pp. 71 2015. 7.De-An Huang et-al, “Self-Learning Based Image Decomposition with Applications to Single Image Denoising”, IEEE Transaction on Multimedia, Volume 16, Number 01, 2014. 8.Ajay Boyat et-al, “Image Denoising using Wavelet Transform and Median Filtering”, Nirma University IEEE International Conference on Engineering (NUiCONE), 2013. 9.Paras Jain & Vipin Tyagi, “Spatial and frequency domain filters for restoration of noisy images”, IETE Journal of Education, 54(2), 108 10.Maggioni, M., Katkovnik, V., Egiazarian, K., Foi, “A.: Nonlocal transform-domain volumetric data denoising and reconstruction”, IEEE Transaction on Image Processing, 22(1), 119–133, 2013. 11.Silva, R. D., Minetto, R., Schwartz, W. Pedrini, H.: Adaptive edge-preserving image denoising using wavelet transforms. Pattern Analysis and Applications. Springer, Berlin doi 10.1007/s10044-012-0266-x, 2012. 12.Zhang, Y., Li, C., Jia, J, “Image denoising using an improved bivariate threshold function in tetrolet domain”, 2013. al, “Image Denoising Using Wavelet Information”, IEEE Conference of Russian Young Researchers in Electrical Discrete Transform Transform and and Edge Edge 2001, 2013. He, K., Sun, J., Tang, X.: Guided image filtering. In: Proceedings European 14, 2010. Porikli, F, “Constant time O(1) bilateral filtering”, In Proceeding IEEE Conference on Computer Vision and Pattern Recognition, Anchorage, pp. and and Electronic Electronic Conference Conference on on al, “A Novel Study on Color Image parison of Various State-of- art Methods”, IEEE International Conference on Trends in Electronics and Informatics (ICEI) H., Ahuja, N, “Real-time O(1) filtering”, Conference on Computer Vision and Pattern gnition, Miami, pp. 557–564, 2009. Farbman, Z., Fattal, R., Lischinski, D., Szeliski, preserving decompositions for multi- scale tone and detail manipulation”, ACM Transactions on Graphics 27(3), 1–10, 2008. Paris, S., Durand, F, “A fast approximation of the bilateral filter using signal processing approach”, In the Proceeding of European Conference on al, “A New Approach of Image Based Discrete IEEE Applications & Research, 2016. Liqiang Shi, “An Improved Image Denoising Algorithm”, Seventh Conference on Measuring Technology and bilateral In In Proceedings Proceedings IEEE IEEE Denoising Transform”, on on World Discrete Symposium Symposium Wavelet Wavelet on on IEEE IEEE International International al, “Gradient Histogram xture Enhanced Image Denoising”, IEEE Transactions on Image Processing, Volume 23, Number 6, June 2014. al, “Epitome based Transform domain Image Denoising”, Published in IEEE, IET Image Processing Magazine, Pp. 71 – 79, –580, 2006. C., Woods, R. E.: Digital image processing, 3rd edn. Prentice-Hall, Upper Saddle Blu, T., Luisier, F, “The SURE-LET approach to image denoising”, IEEE Transaction Image Learning Based Image 2786, 2007. Decomposition with Applications to Single Image Denoising”, IEEE Transaction on Multimedia, Paris, S., Durand, F.: A fast approximation of the bilateral filter using signal processing approach. In: Proceeding European Conference on Computer 580, 2006. Dabov, K., Foi, A., Katkovnik, V., Egiazarian, K.: Image denoising with block-matching and 3D filtering. In: SPIE electronic imaging: algorithms and systems, vol. 6064, pp. 606414-1–606414-12, al, “Image Denoising using Wavelet Transform and Median Filtering”, Nirma International Conference on Paras Jain & Vipin Tyagi, “Spatial and frequency domain filters for restoration of noisy images”, IETE Journal of Education, 54(2), 108-116, 2013. Maggioni, M., Katkovnik, V., Egiazarian, K., Foi, Sub band noise estimation for adaptive wavelet shrinkage. In: Proceeding 17th International Conference Recognition, vol. 4, pp 885–888, 2004. Elad, M.: On the origin of the bilateral filter and ways to improve it. IEEE Transaction Image domain filter filter for for on on Pattern Pattern volumetric data denoising and reconstruction”, IEEE Transaction on Image Processing, 22(1), D., Minetto, R., Schwartz, W. R., 1151, 2002. W.: Bivariate shrinkage based denoising exploiting preserving image let transforms. Pattern Analysis and Applications. Springer, Berlin doi: interscale dependency. IEEE Trans. Signal 2756, 2002. Chang, S., Yu, B., Vetterli, M.: Spatially adaptive wavelet thresholding based on context modeling for image denoising. IEEE Trans. Image Process. Zhang, Y., Li, C., Jia, J, “Image denoising using an improved bivariate threshold function in @ IJTSRD | Available Online @ www.ijtsrd.com www.ijtsrd.com | Volume – 2 | Issue – 6 | Sep-Oct 2018 Oct 2018 Page: 226