Download
1 / 8
80 likes | 104 Views
Heat Exchangers are generally used for transferring of heat from one part fluid to another. There are various types of heat exchangers. Among all, tube type heat exchangers with helical profile show better result. The flow in heat exchangers can be Parallel flow or counter flow. In the present work, CFD analysis of a helical shaped heat exchanger for parallel as well as counter flow conditions has been done. In this work, CFD analysis for the performance analysis of counter flow type flow condition has been carried out. The various parameters such as temperature plots, velocity vectors, Nusselt number, heat transfer rate from the wall of the tube has been calculated using ANSYS 13.0. It has been found out that the results are approximately similar for counter flow and parallel flow conditions for the considered helically shaped tube type heat exchanger. Anirban Jana | N. V. Saxena "Analysis of Helical Shape Tube Type Heat Exchanger using CFD" Published in International Journal of Trend in Scientific Research and Development (ijtsrd), ISSN: 2456-6470, Volume-4 | Issue-5 , August 2020, URL: https://www.ijtsrd.com/papers/ijtsrd33035.pdf Paper Url :https://www.ijtsrd.com/engineering/mechanical-engineering/33035/analysis-of-helical-shape-tube-type-heat-exchanger-using-cfd/anirban-jana<br>

E N D
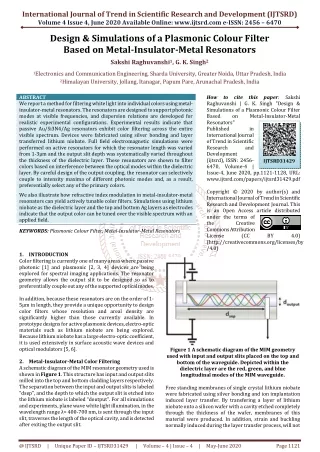
International Journal of Trend in Scientific Research and Development (IJTSRD) Volume 4 Issue 4, June 2020 Available Online: www.ijtsrd.com e-ISSN: 2456 – 6470 Design & Simulations of a Plasmonic Colour Filter Based on Metal-Insulator-Metal Resonators Sakshi Raghuvanshi1, G. K. Singh2 1Electronics and Communication Engineering, Sharda University, Greater Noida, Uttar Pradesh, India 2Himalayan University, Jollang, Itanagar, Papum Pare, Arunachal Pradesh, India ABSTRACT We report a method for filtering white light into individual colors using metal- insulator-metal resonators. The resonators are designed to support photonic modes at visible frequencies, and dispersion relations are developed for realistic experimental configurations. Experimental results indicate that passive Au/Si3N4/Ag resonators exhibit color filtering across the entire visible spectrum. Devices were fabricated using silver bonding and layer transferred lithium niobate. Full field electromagnetic simulations were performed on active resonators for which the resonator length was varied from 1-3μm and the output slit depth was systematically varied throughout the thickness of the dielectric layer. These resonators are shown to filter colors based on interference between the optical modes within the dielectric layer. By careful design of the output coupling, the resonator can selectively couple to intensity maxima of different photonic modes and, as a result, preferentially select any of the primary colors. We also illustrate how refractive index modulation in metal-insulator-metal resonators can yield actively tunable color filters. Simulations using lithium niobate as the dielectric layer and the top and bottom Ag layers as electrodes indicate that the output color can be tuned over the visible spectrum with an applied field. KEYWORDS: Plasmonic Colour Filter, Metal-Insulator-Metal Resonators How to cite this paper: Sakshi Raghuvanshi | G. K. Singh "Design & Simulations of a Plasmonic Colour Filter Based on Metal-Insulator-Metal Resonators" Published in International Journal of Trend in Scientific Research and Development (ijtsrd), ISSN: 2456- 6470, Volume-4 | Issue-4, June 2020, pp.1121-1128, URL: www.ijtsrd.com/papers/ijtsrd31429.pdf Copyright © 2020 by author(s) and International Journal of Trend in Scientific Research and Development Journal. This is an Open Access article distributed under the terms of the Creative Commons Attribution License (CC (http://creativecommons.org/licenses/by /4.0) IJTSRD31429 BY 4.0) 1.INTRODUCTION Color filtering is currently one of many areas where passive photonic [1] and plasmonic [2, 3, 4] devices are being explored for spectral imaging applications. The resonator geometry allows the output slit to be designed so as to preferentially couple out any of the supported optical modes. In addition, because these resonators are on the order of 1- 5μm in length, they provide a unique opportunity to design color filters whose resolution and areal density are significantly higher than those currently available. In prototype designs for active plasmonic devices, electro-optic materials such as lithium niobate are being explored. Because lithium niobate has a large electro-optic coefficient, it is used extensively in surface acoustic wave devices and optical modulators [5, 6]. 2.Metal-Insulator-Metal Color Filtering A schematic diagram of the MIM resonator geometry used is shown in Figure 1. This structure has input and output slits milled into the top and bottom cladding layers respectively. The separation between the input and output slits is labeled “dsep”, and the depth to which the output slit is etched into the lithium niobate is labeled “doutput”. For all simulations and experiments, plane wave white light illumination, in the wavelength range λ= 400-700 nm, is sent through the input slit, traverses the length of the optical cavity, and is detected after exiting the output slit. Figure 1 A schematic diagram of the MIM geometry used with input and output slits placed on the top and bottom of the waveguide. Depicted within the dielectric layer are the red, green, and blue longitudinal modes of the MIM waveguide. Free standing membranes of single crystal lithium niobate were fabricated using silver bonding and ion implantation induced layer transfer. By transfering a layer of lithium niobate onto a silicon wafer with a cavity etched completely through the thickness of the wafer, membranes of this material were produced. In addition, strain and buckling normally induced during the layer transfer process, will not @ IJTSRD | Unique Paper ID – IJTSRD31429 | Volume – 4 | Issue – 4 | May-June 2020 Page 1121
International Journal of Trend in Scientific Research and Development (IJTSRD) @ www.ijtsrd.com eISSN: 2456-6470 affect these membrane layers because of the fact that there is no substrate to constrain the film. A diagram of this is shown in Figure 2. Figure 2 A schematic diagram of the lithium niobate membrane fabrication. Optical microscopy images of a transferred lithium niobate membrane show an intact, layer transferred film, Figure 3(a). Small defects can be seen scattered across the surface of the membrane; however, these defects, as well as the roughness of the top surface of the transfered layer in general, can be removed through the use of chemical-mechanical polishing steps after the layer transfer process is complete. Once the membrane is formed and polished, a top layer of silver is deposited to produce the desired MIM membrane. To mill sub-wavelength input and output slit into the membrane, the FIB is used. These slits were milled through the silver layer and to varying depths within the lithium niobate layer. In addition to changing the depth to which the output slits were milled (doutput), the separation between the input and output slits (dsep) was also varied. An example of this is shown in Figure 3(b). Figure 3 Layer transfered lithium niobate membranes using silver bonding, (a). A membrane of LiNbO3 that has gone through FIB and is ready for measurements, (b). 3.Determining the Experimentally Observed Color To calculate the color that a viewer would observe at the device output, the spectral sensitivity of the color sensitive cones within the human eye must be taken into account. To do this, the CIE (1964) color matching functions were used to correlate the chromatic response of the eye of a viewer over the visible range of the MIM output spectrum. The red, green, and blue spectral sensitivity curves of the human eye are shown from 400 - 700 nm in Figure 4. The transmitted optical power spectrum through the output slit of each device was recorded. For finite-difference time domain simulations of these structures, the output power was normalized to the source power at each wavelength. The resulting color output was calculated by taking the inner product of each of the R, G, and B, color matching functions with the optical intensity from a specific device over the entire visible spectrum [9]. Then, color scales were developed that illustrated the output color seen by a viewer. @ IJTSRD | Unique Paper ID – IJTSRD31429 | Volume – 4 | Issue – 4 | May-June 2020 Page 1122
International Journal of Trend in Scientific Research and Development (IJTSRD) @ www.ijtsrd.com eISSN: 2456-6470 Figure 4 The 1964 CIE red, green, and blue color matching functions used in determining the output color from each MIM device. 4.Results from Passive Silicon Nitride Color Filtering Initial testing of these color filters was done with passive devices. Experimental measurements of these structures showed color filtering across the red, green, and blue regions of the visible spectrum. The devices shown in Figure 5(a) consist of a 500 nm silicon nitride freestanding membrane coated on top with 400 nm of gold and with 400nm of silver on the bottom side of the silicon nitride membrane. Input and output slits were defined by 20 keV Ga+ focused beam in a focused ion beam lithography etching system. The devices were illuminated with a halogen white light source and colors were recorded by color imaging in an optical microscope with a 50x objective using a digital camera. In Figure 5(a) each device exhibits a different color at its output slit, and the colors shift across the entire visible spectrum as a function of the spacing between the input and output slits. Here the resonator length dsep = 2.5, 3.5, and 4 μm for devices 1 - 3 respectively, with a slit width of 400 nm. For all devices shown in Figure 5(a), the slit depths were dinput=doutput=250 nm. The corresponding output spectra from these devices are shown in Figure 5(b). For each curve in Figure 5(b), the color used to plot the spectrum corresponds to the RGB value calculated using the method described in the previous section with each output spectrum shown in Figure 5(b). The fact that the calculated color from the device output spectrum is the same as the experimentally observed color confirms that the output spectrum were correctly converted into an equivalent observable color. The dispersion diagram for this structure is shown in Figure 6. These dispersion diagrams were calculated using a Nelder-Mead minimization of numerical solutions to Maxwell’s equations [7]. Regions of the dispersion diagram that have a high photonic or plasmonic modal intensity appear darker (red and grey/black) and regions with little or no modal intensity appear lighter (green and blue). Figure 6 shows the existence of the plasmonic and three photonic modes across the visible spectrum. Figure 5 The 1964 CIE red, green, and blue color matching functions used in determining the output color from each MIM device. @ IJTSRD | Unique Paper ID – IJTSRD31429 | Volume – 4 | Issue – 4 | May-June 2020 Page 1123
International Journal of Trend in Scientific Research and Development (IJTSRD) @ www.ijtsrd.com eISSN: 2456-6470 Figure 6 The dispersion diagram for these structures is plotted in (c), and shows one plasmonic and three photonic modes within the visible spectrum. 5.Modeling Active Color Filters To study active color filtering, samples were measured experimentally with a halogen white light source and colors were recorded by color imaging in an optical microscope with a 50x objective using a digital camera. To model these devices, simulations were done using Lumerical, finite-difference time-domain software. The structures used in the simulations had 400 nm of silver on the top and bottom of the waveguide with 300 nm of lithium niobate as the dielectric layer. The devices were simulated under broadband transverse magnetic illumination from λ = 400 - 700 nm. All simulations were done with and without an applied electric field. X-cut lithium niobate single crystal samples were obtained from the MTI Corporation. Using spectroscopic ellipsometry, the complex index of refraction of the lithium niobate was measured, and this data was used for all simulations. The top and bottom silver layers of the MIM waveguide were modeled using the materials parameters within the Lumerical materials database. The experimental lithium niobate data was fit from 400-700 nm as a Cauchy layer given by: n(λ)=n0+ C0n1/λ2+ +C1n2/λ4 (1) k(λ)=k0+C0k1/ λ2 +C1k2/ λ4 (2) where n0 = 2.093, n1 = 305.9, n2 = 52.9, k0 = 0.02, k1 = 24.541, k2 = 23.276,C0 = 102,C1 = 107, and λ is given in nm. The reported coercive field for this material is ~4 kV/mm, and under an applied electric field greater than this, the lithium niobate was modeled as having a refractive index increase of ~0.12 across the visible spectrum, and the imaginary part of the index was kept the same as in the zero field case. This change in refractive index is consistent with domain switching in ferroelectric lithium niobate crystals [8]. 5.1.Varying the Output Coupling Separation For all simulations involving lithium niobate, dinput = 150 nm. Simulations show that by holding dinput and doutput constant while varying dsep, the intensity of the most efficiently out-coupled color oscillates as the output slit couples to either a maximum or minimum in the selected color’s electric field. Figure 7 Output colors from MIM waveguides with dinput = 150 nm into the top half of the lithium niobate layer and doutput = 260 nm into the lithium niobate layer from the bottom of the structure. The output colors are plotted as a function of the spacing between the input and output slits. The bottom stripe of color is for devices under an applied field and the top stripe of color is for devices under no applied field. @ IJTSRD | Unique Paper ID – IJTSRD31429 | Volume – 4 | Issue – 4 | May-June 2020 Page 1124
International Journal of Trend in Scientific Research and Development (IJTSRD) @ www.ijtsrd.com eISSN: 2456-6470 Figure 7 shows the colors from devices with doutput = 260 nm and dsep is varied from 1-3 μm in 50 nm steps. The top color stripe corresponds to devices under no applied electric field and the bottom color stripe corresponds to devices under an applied field. With no applied field, oscillations between the green and red modes can be seen. It can also be seen that when dsep is such that the red mode is at a minimum, the green mode is most efficiently coupled through the output slit. Conversely, when the intensity of the red mode is a maximum, it is most efficiently coupled through the output slit and dominates the device transmission. By applying an electric field, the red mode dominates the device transmission and the resulting colors appear red-shifted. Figure 8 shows the normalized power transmission through the devices from Figure 7. The top pane corresponds to transmission under no applied electric field and the bottom pane corre-sponds to transmission under an applied field. The transmission at three representative wavelengths of 450, 531.5, and 649.2 nm were selected from the entire visible spectrum and were plotted in blue, green, and red respectively. As was mentioned above, when dsep is such that the red mode is at a minimum, the green mode is most efficiently coupled through the output slit. The lower transmission plot shows that with an applied field, the transmission of the green mode is suppressed with respect to that of the red and blue modes. As a result, the dominant green oscillations that are seen in the top color stripe of Figure 7 are no longer present in the bottom color stripe. Figure 8 Power transmission through MIM waveguides with dinput = 150 nm into the top half of the lithium niobate layer and doutput = 260 nm into the lithium niobate layer from the bottom of the structure. The bottom plot is for devices under an applied field and the top is for devices under no applied field. The source of the oscillations seen in Figure 8 is different for each of the three wavelengths sampled. For these MIM waveguides, the 200 nm wide output slit acts as a convolution function when it “samples” the optical modes by coupling them out of the device. The oscillations at 650 nm are from the slit coupling to maxima and minima of the mode as dsep is varied from 1-3 μm. For the intensity at 530 nm, the “convolution length” of the slit is on the order of half the wavelength of the mode being sampled. As a result, there are small oscillations in the output intensity as dsep is varied; however, any major oscillations are damped out as a result of the slit width. Hence, the main shape of the green curve is simply determined by the decay of the mode as dsep is increased. The oscillations of the blue curve result from beating between two modes propagating at 450 nm. Since this beating period is much larger than the actual period of either of the two modes involved, the oscillations can again be resolved by the 200 nm output slit. Figure 8 also shows that for a given resonator, the transmitted power at a given wavelength is on the order of 0.05%; however, this metric is best suited for devices that transmit a single or narrow band of wavelengths. In the case of these MIM color filters, the resonators pass a broad-band spectrum. When this intensity spectrum is integrated with the RGB color matching functions over the entire visible spectrum, the total amount of transmitted power is significantly increased. Ongoing work is focused on optimizing the design of the input and output slits to increase the total amount of transmitted power; however, initial results indicate that the total broadband transmitted power can be increased by at least an order of magnitude. @ IJTSRD | Unique Paper ID – IJTSRD31429 | Volume – 4 | Issue – 4 | May-June 2020 Page 1125
International Journal of Trend in Scientific Research and Development (IJTSRD) @ www.ijtsrd.com eISSN: 2456-6470 5.2.Varying the Output Coupling Depth Figure 9 The dispersion diagram for the MIM structure with 300 nm of lithium niobate between two, 400 nm layers of silver. Modeling the dispersion of the MIM waveguides shows the existence of the plasmonic and three photonic modes, as illustrated in Figure 9, which is a plot of the frequency dependence of the real part of the wavevector. For a lithium niobate layer 300 nm thick, the dispersion calculations show that the structure’s three photonic modes lie in the regions 1.9, 2.5, and 3eV, which correspond to the red, green, and blue regions of the visible spectrum respectively. Figure 10(a) shows the red, green and blue photonic mode profiles moving through the MIM waveguide. Not shown here is the mode profile of either the symmetric or anti-symmetric plasmon modes. Full field electromagnetic simulations of these structures show the electric field distribution throughout the entire waveguide, Figure 10(b). The three field profiles shown here are plotted at λ = 400, 530, and 650 nm. These plots correspond to the three modes shown in Figure 10(a) and 9. The MIM waveguides modeled in Figure 10(c) had a constant dsep = 2000 nm for all devices, with and without an applied electric field. For these simulations, doutput was increased from 100 - 300 nm into the lithium niobate, in 2 nm increments from one colored panel to another in Figure 10(c). By simply varying the depth of the output slit into the lithium niobate layer, one can preferentially couple to the different photonic modes and output any of the primary colors. In Figure 10(c), the top color stripe corresponds to no applied electric field and the bottom color stripe corresponds to devices under an applied field. For these specific devices, the output slit most efficiently couples to the red mode with and without an applied electric field for slit depths below ~150 nm. With no applied electric field, the output slit most efficiently couples to the green mode between 250 nm and 275 nm, and with an applied field, the output slit most efficiently couples to the blue mode above ~285 nm. Figure 10 Mode profiles for the red, green, and blue photonic modes (a). Full field electromag-netic simulations of the entire waveguide at λ = 400, 530, and 650 nm are shown in (b). The resulting output colors from a MIM waveguide with an input-output slit spacing of 2000 nm are shown in (c). The top stripe of color is for devices under no applied field and the bottom stripe is for devices under an applied field. @ IJTSRD | Unique Paper ID – IJTSRD31429 | Volume – 4 | Issue – 4 | May-June 2020 Page 1126
International Journal of Trend in Scientific Research and Development (IJTSRD) @ www.ijtsrd.com eISSN: 2456-6470 6.Losses As we saw in Figure 8, losses within MIM waveguides are substantial. These losses can be broken down into two categories: cavity losses and slit losses. For a lithium niobate MIM waveguide with dsep = 1 μm, calculations show that there is 7.53 dB of loss at the input slit, 5.85 dB of loss through the lithium niobate, and 5.68 dB of loss through the output slit. Hence, while these devices enable extremely high modal confinement, the losses are currently such that their use as long range waveguides is challenging. For MIM waveguides where the dielectric thickness is below cutoff for all of the photonic-like modes, the only modes supported are the symmetric and anti-symmetric plasmon modes [11]. In this case, a significant amount of the electric field of these “bound” modes resides in the metal. As a result, there is usually a tradeoff between confinement and loss. In a MIM structure, these losses are a result of both ohmic losses within the metal as well as field interference from phase shifts induced by the metal between the two metal-dielectric interfaces within the waveguide [12]. As the thickness of the dielectric layer is increased beyond the photonic cutoff thickness, an increasing amount of the light resides within the photonic-like modes whose losses are dominated by the intrinsic losses of the dielectric. The other source of loss within these waveguides is slit losses. From a single slit, coupling into and out of these devices introduces ~5-7 dB of loss. For shorter devices, these losses dominate the overall transmittance. As a result, recent work has focused on improving the amount of light that can be sent through individual slits while still coupling efficiently to the various photonic and plasmonic modes that are supported. 7.Increasing Slit Transmission To increase the amount of light transmitted through these color filters, the design of the input and output slits was studied in a variety of geometries. Initial studies focused on both trapezoid shaped input/output slits as well as a trapezoid/rectangle hybrid design in which the portion of the slit milled into the metal cladding layer of the waveguide was trapezoid in shape and upon reaching the lithium niobate, the slit was milled as a rectangle (with vertical sidewalls). For both trapezoidal and hybrid designs, all input/output slit separations were 2 μm, and all slits were milled half way into the lithium niobate. Also, the width of both the bottom and top of the slits was varied while any given dimension was the same for both the input and output slits. Figure 11(a) shows the trapezoidal input and output slit designs. Figure 11(b) shows the total integrated power transmitted through the waveguide, normalized to the source, for (a) as a function of slit dimensions. The x-axis represents the width of the trapezoid where it is terminated within the lithium niobate, and the colors of the lines (shown in the legend) represent the width of the trapezoid where it is terminated at the silver/air interface. The green dots represent trapezoids where the top and bottom dimensions are the same, i.e. the slits are rectangles. For comparison, the red “*” represents the standard, 200 nm wide slits that were used throughout this paper. Figure 12(a) shows the hybrid input and output slit designs. Figure 12(b) shows the total integrated power transmitted through the waveguide, normalized to the source, for (a) as a function of slit dimensions. The x-axis represents the width of the rectangular portion of the slit that is milled into the lithium niobate and the colors of the lines (shown in the legend) represent the width of the trapezoid where it is terminated at the silver/air interface. As was the case in Figure 11(b), the green dots represent rectangular slits with the specified dimensions and the red “*” represents the standard, 200 nm wide slits that were used throughout this paper. Even in these initial studies which vary the shape and dimensions of the input and output slits, Figures 11 and 12 both show that the amount of transmitted light through these devices can be significantly (sometimes at least an order of magnitude) increased by a simple optimization. It should be noted that this simple, first-order study of slit geometries does not optimize the slits to provide the most distinct colors or most efficiently couple into all the different optical modes that the cavity supports. For simplicity, all the dimensions of the input and output slits were exactly the same in all simulations; however, future work will focus on varying these parameters independently to better optimize the devices for a given application. Figure 11 Schematic of the trapezoid slit design and FDTD simulations, (a). Transmission through the device as a function of bottom slit dimension (x-axis) and top slit dimension (legend). Figure 12 Schematic of the trapezoid/rectangle hybrid slit design and FDTD simulations, (a). Transmission through the device as a function of bottom slit dimension (x-axis) and top slit dimension (legend). @ IJTSRD | Unique Paper ID – IJTSRD31429 | Volume – 4 | Issue – 4 | May-June 2020 Page 1127
International Journal of Trend in Scientific Research and Development (IJTSRD) @ www.ijtsrd.com eISSN: 2456-6470 8.High Density Color Filtering Design To further increase the total amount of light transmitted through the waveguides, the design scheme presented here could be easily integrated into a high density array of metal- insulator-metal resonator color filters. By fabricating two output slits equally spaced on either side of an input slit, one could double the total amount of transmitted light. By close packing three of these structures together with three input slits, each rotated by ±120◦ with respect to the other two, a hexagonal “MIM pixel” could be produced. A cross-section of such a device is shown in Figure 13(a). The top pane represents the output slits of the device and the bottom pane shows the input slits. The largest dimension of such a pixel would be ~3−5 μm. At present, this is 1− 2 orders of magnitude smaller than the best high-definition color filters currently available [14]. Thus, these devices provide ~0.05% transmittance through an individual device is two to three orders of magnitude lower than traditional LCD color filters, the density of these devices in a two-dimensional array is two to three orders of magnitude higher than traditional LCD color filters. If instead of high resolution, a higher transmission is required, the hexagonal pixels could be tiled together to form “superpixels”, Figure 13(b). These structures could be designed such that the largest dimension is still smaller that the ~80 μm resolution limit of the human eye at 35 cm [15]. To maintain a uniform density of all three colors, the slit spacing can be kept constant over all devices and the different colors of each “superpixel” can be selected by simply varying the depth of that pixels’ output slits. For a given 5μm slit at a given wavelength within the superpixel structure, these devices provide between 0.02% and 0.1% transmission. A three-dimensional schematic of such astructure is shown in Figure 13(c). of the human eye. A three-dimensional rendering of such a device is shown in (c). 9.Conclusion In this paper we have shown that metal-insulator-metal waveguides utilizing lithium niobate offer a unique opportunity for tunable light filters. By varying the spacing between the input and output slits, the intensity of a selected color oscillates as a function of the separation. Also, by varying the output slit depth within the device, one can preferentially couple to each of the photonic modes within the waveguide. The electro-optic effect of lithium niobate allows the selected output color to be shifted across the red, green, and blue regions of the visible spectrum. Furthermore, these structures could produce color pixels that are orders of magnitude smaller than current technologies and could provide an opportunity for devices with a significantly higher resolution than those currently available. In this work we have shown that, with proper design, single crystal thin film layers of ferroelectrics can be produced using ion implantation induced layer transfer. Silver bonding can improve the adhesion between the transfered film and the substrate to which it will be bonded. These methods can be used to fabricate single crystal MIM waveguides which can be used in tunable color filtering. In the following work we will explore using doped silicon and transparent conducting oxides as the active layer of the MIM waveguide. References: [1]H. Park, C. Barrelet, Y. Wu, B. Tian, F. Qian, and C. Lieber, Nature Photonics, vol. 2, p.622, 2008. [2]B. Barnes and R. Sambles, Physics World, vol. 19, p. 17, 2006. [3]E. Laux, C. Genet, T. Skauli, and T. Ebbesen, Nature Photonics, vol. 2, p. 161, 2008. [4]N. van Hulst, Nature Photonics, vol. 2, p. 139, 2008. [5]Properties of Lithium Niobate. INSPEC, Inc, 2002. [6]M. Fejer, G. Magel, D. Jundt, and R. Byer, IEEE Journal of Quantum Electronics, vol. 28, p. 2631, 1992. [7]J. Dionne, L. Sweatlock, and H. Atwater, Physical Review B, vol. 72, p. 075405, 2005. [8]Properties of Lithium Niobate. The Institution of Engineering and Technology, 2002. [9]A. Lien, C. Cai, R. John, J. Galligan, and J. Wilson, Displays, vol. 22, p. 9, 2001. [10] D. Betancourt and C. del Rio, IEEE Sensor Array Workshop, p. 93, 2006. [11]S. Maier, Plasmonics: Fundamentals and Applications. Springer, 2007. [12]J. Dionne, L. Sweatlock, H. Atwater, and A. Polman, Physical Review B, vol. 73, p. 035407, 2006. [13]A. Lien, C. Cai, R. John, J. Galligan, and J. Wilson, Displays, vol. 22, p. 9, 2001. [14]Chemical Mechanical Planarization of Microelectronic Materials. John Wiley and Sons,1997. [15]Properties of Lithium Niobate. INSPEC, Inc, 2002. [16]M. A. Butt and S. A. Fomchenkov "A plasmonic colour filter based on metal-insulator-metal square micro-ring cavities for visible spectrum", Proc. SPIE 11516, Optical Technologies for Telecommunications 2019, 115160G (22 May 2020) Figure 13 Cutaway view of a six-sided MIM color filter (a). The top panel shows half of the hexagonal output structure while the bottom panel shows half of the three-slit input configuration for a given hexagon. (b) shows a tiling layout for a red-green-blue “superpixel” design where the largest dimension of each red-green- blue combination is smaller than the resolution limit @ IJTSRD | Unique Paper ID – IJTSRD31429 | Volume – 4 | Issue – 4 | May-June 2020 Page 1128