Download
1 / 5
50 likes | 126 Views
Explore U.S. involvement in foreign affairs through wars and geographical distribution from 1891 to 1945. See patterns of war frequency by year and location in this informative chart.

E N D
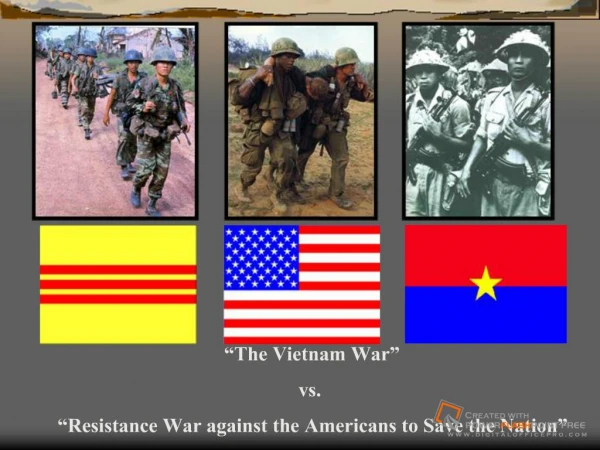
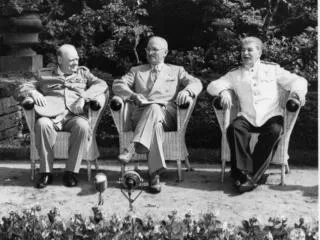
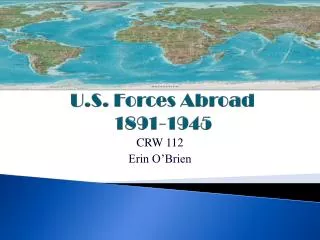
U.S. Forces Abroad1891-1945 CRW 112 Erin O’Brien
The United States is constantly getting involved with foreign affairs in attempt to protect people, land, and government. This pie chart shows that the majority of the time, the U.S. goes to war when trying to protect its citizens and defend its land.
Frequency of Wars by Year These all represent the amount of wars that have taken place between each time period. We chose this time chart to emphasize the United States foreign policy with other countries. 1891 – 1901 -> 19 1902 – 1912 -> 23 1913 – 1923 -> 23 1924 – 1934 -> 10 1935 – 1945 -> 6
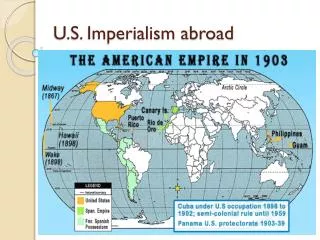
Distribution of Wars by Location This Pie Chart represents the geographical distribution of America’s foreign affairs in 1891-1945. America had many encounters with other countries and spent most of its time in the Pacific region. This is because there were many encounters with China. The other large portion was because of the involvement in the Central America region.
Team Members Stephanie Banos Shardaye Berry Mayanne Chow Christopher Lupi Thao Ly Stephanie McGrath Michael Morgillo Samantha Place