Download
1 / 12
120 likes | 131 Views
Announcements for homework deadlines, course evaluations, transparency in science, and upcoming demonstrations. Exploring error incorporation in visual data for better accuracy. Listing other related courses in scientific computing and graphics. Seeking feedback for curriculum improvement.

E N D
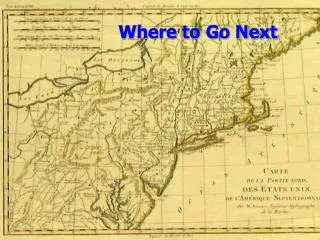
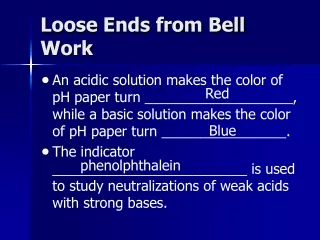
Outline Announcements: Homework IV due Friday by 5, by e-mail Answers will be posted on web Only available after Tuesday by e-mail (slow response). However, I will be available 8:30-1 on Monday and by appointment Homework III: answers on web Homework III & Awards Demo Controlling transparency and using it for science Where to go from here Course Evaluations
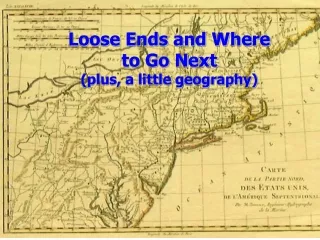
Homework III Nice job! Only problem was with your geography
Awards Will be announced in class! Don’t miss this!
Demo Gus Lott will demonstrate a GUI he developed for exploring proteins with in a fluid jet.
Making transparency useful Statistical interpolation techniques (like kriging) give you a distribution of values and an estimate of their accuracy (error variance) Most people will simply plot the interpolated data and ignore the error maps Ideally, we would incorporate error into the image so that it is easy to tell which values we believe
Old GOM Figure Interpolated temperature data (point samples) on to trianglular mesh using kriging Set points with value < V and error > E to Nan Plotted as a patch with color proportional to T (had to append blue-white map to colormap)
New GOM Figure Want to incorporate error in a less arbitrary manner Let trasnparency be proportional to error 1) create a surface at Z=-100 m with color proportional to temp 2) set its alphadata to E where E=-1*error+1 (in [0 1]) • 3) create an alphamap and place it in axes • 4) set alphalimits (alim) of figure to [0 1]
New GOM Figure Implemented in GOMLSSWplot.m
Other Scientific Visualization Courses This is the only course to focus on scientific visualization, especially using Matlab. If you are interested in computer graphics: CS 417: Computer Graphics and Visualization (lear OpenGL, make $$$) If you are interested in making effective visualizations: try the Communications Department which offers courses on visual communication, human-computer interaction, and scientific writing
Other Scientific Computing Courses CIS Tools Curriculum Fall: MATLAB 401: the basics 402: visualization Spring: General tools 403: Developing scientific computer programs (compilers, debuggers, managing large projects) 404: Numerical libraries 403 begins Feb. 18 404 begins March 25 (after spring break)
Evaluations Please give me as much data as you can specific lecture/topics you liked & those you didn’t other topics to cover? Tools Curriculum & mini-course format? Thanks!