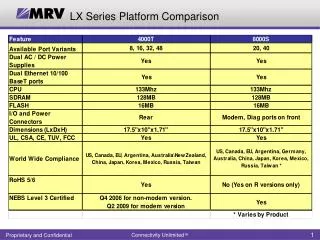
Microarray Platform Comparison RoundTable Discussion
Microarray Platform Comparison RoundTable Discussion. Participants: Barry Merriman, UCLA Dept of Human Genetics Peter Herzer, Phd., Amersham Bioscience Applications Consultant Damon Harvey, Affymetrix field applicaions scientist James Willey, M.D. -Medical College of Ohio

Microarray Platform Comparison RoundTable Discussion
E N D
Presentation Transcript
Microarray Platform ComparisonRoundTable Discussion Participants: Barry Merriman, UCLA Dept of Human Genetics Peter Herzer, Phd., Amersham Bioscience Applications Consultant Damon Harvey, Affymetrix field applicaions scientist James Willey, M.D. -Medical College of Ohio -GeneExpress, Inc -Standardized Expression Measurment Center
A Comparison of Multiple Microarray Platforms for Gene Expression Barry Merriman, Stan Nelson UCLA Department of Human Genetics Credits: Gene Expression Data Generated by: NINDS-NIMH Microarray Consortium Members: Don Baldwin, Pate Skene, Holly Dressman, Deitrich Stephan, Keri Pearson, Stan Nelson, Zugen Chen And: Charlie Xiang, NIH Microarray Core CodeLink group, Amersham, Inc. Riggins Lab, Duke (SAGE data) James Willey, Standard Expression Measurement Core, (RT-PCR data) Ruty Shai, USC Microarray Core
Abstract A variety of microarray platforms are available for doing whole genome gene expression measurement. The new NINDS-NIMH Microarray Consortium was created to provide access to these technologies for sponsored researchers. As a first step, the Consortium members have undertaken a large scale comparison of the currently available platforms, to characterize the repeatability, accuracy, sensitivity and agreement among the diverse options. The study is based upon assaying aliquots from four total RNA samples ( from bulk, normal Human Liver, Kidney, and Spleen, and the Stratagene Human Reference pool) on diverse platforms, each sample done in triplicate, with the assays carried out at facilities well-versed in the respective techniques. The platforms include whole genome pre-fabricated oligo arrays from Affymetrix, Agilent and Amersham, plus custom spotted arrays from whole genome oligo sets from Operon, ClonTech and MWG, plus 33,000 clone custom spotted cDNA arrays. In addition to testing for repeatability and consistentcy, independent validation of accuracy and sensitivity is provided by assaying the same samples via large scale quantitative RT-PCR (100 genes assayed by the Standard Expression Measument Center, targeting the 100 genes most discordant between microarray platforms), and SAGE analysis (direct molecular transcript counting). We summarize the many dimension in which these approaches agree and disagree; overall there is good repeatability and fair concordance between the major commercially fabricated microarray platforms and spotted cDNA/Oligo arrays. However, substantial disagreements arise as well.
About our Sponsor: The Consortium is a new resource for NINDS/NIMH-fundedresearchers. For More info, see their website below The Consortium provides access to array technology for NINDS & NIMH sponsored researchers Go to: http://arrayconsortium.cnmcresearch.org
Multi-Platform Comparison Strategy:Apply multiple microarray platforms to same RNA samples. Study: Repeatability, Agreement and Accuracy of Diverse Platforms. RNA Samples: (isolated and aliquoted at UCLA) Normal Human Liver, Kidney, Spleen, Universal (= RNA from Stratagene, Inc., pooled from 10 Cancer cell lines) Microarray Platforms: cDNA: Custom Spotted cDNA Arrays; 33,000 Clones (from Xiang NIH Core) Affymetrix: Affymetrix U133A (25-mer Oligo Arrays; 22,000 genes) (quantified w/ MAS v5.0) Agilent: Agilent 18,000 gene 60-mer arrays Operon: Custom Spotting of: Operon 18,000 gene 70mer Oligo Set ClonTech: Custom Spotting of: ClonTech Atlas 80-mer Oligo Set; 13,000 genes Amersham: CodeLink 20,000 gene 30-mer printed oligo arrays Also: NON-microarray Gene Expression for Validation SAGE :“Transcript Counting” (Riggins Lab @ Duke) Universal RNA sample (~15,000 genes) Quantitative RT-PCR: Standardized Exprs. Meas. Center (Willey) (100--500 genes) + MWG spotted oligo array, New Affy A+B Chip
Framing the Issues To Consider Basic Data: • Each Platform Provides two Measures: • A Ratio Measurement: ratio of gene in Tissue A / Tissue B • A “Detection Indicator”: whether gene is expressed in tissues A and B • For Affymetrix: Presence/Absence Call (or detection P value) • For other Arrays: Spot Brightness ranking (in Cy3 and/or Cy5 ), hi-to-low Key Statistics To be Obtained: • Repeatability of Platform within a lab • Correlation between ratios from repeat experiments (R2) (# > 2x change) • Uncertainty of repeat ratio measurements (Standard Deviation) • Agreement between different Platforms • Correlation between TissueA/TissueB ratios between platforms (R2) (# > 2x change) • Uncertainty of TissueA/TissueB ratios between platforms (Std. Dev.) Key Considerations in the analysis: • Only expect repeatability/agreement on “reliably detected” genes • Above statistics should be based on well-detected genes General Surrogate for Reliable Detection: use brightest 10,000 probes on the Array 5,000 (more stringent)
Multi-Platform Comparison Strategy: Apply multiple microarray platforms at multiple sites to same RNA samples to study: Repeatability, Agreement and Accuracy of the Diverse Platforms. Common RNA Samples: (isolated and aliquoted at UCLA) (Human) Liver, Kidney, Spleen, Universal (= Standardized RNA Pool from Stratagene, Inc., from 11 Cancer cell lines) Current Data: NIH: Tech: Custom Spotted cDNA Arrays; 33,000 Clones 2 color hybs, Tissue vs Universal, with x 3 replicates TGEN: Tech: Affymetrix U133A (In-situ Synthesis 25-mer Oligo Arrays; 15,000 genes) (quantified w/ MAS v5.0) 1 color hybs, x 3 replicates x (old and new affy scanner system) U of Pennsylvania: Tech: Affymetrix U133A (quantified w/ MAS v5.0) 1 color hybs, x 1 replicates Duke: Tech: Custom Spotting of: Operon 18,000 gene 70mer Oligo Set 2 color hybs, x 2 replicates x 2 (for Dye swapping) UCLA: Tech: Affymetrix U133A (quantified w/MAS v5.0) , 1 color hybs, x 1 replicate (coming: new affy A+B chip) Tech: Agilent “Human 1A” (In-situ Synthesis 60-mer Oligo Arrays); 17,000 genes 2 color Tissue vs. Universal, with x 3 replicates Tech: Custom Spotting of Clontech Atlas 80-mer Oligo Set; 13,000 genes 2 color Tissue vs. Universal, with 3 x replicates Amersham: (experiments performed and quantified at Amersham) Tech: CodeLink 20,000 30-mer printed oligo arrays, triplicate 1 color hybs on Kidney, Spleen, Universal USC Array Core: Custom Spotting of 10,000 MWG 70-mer oligos, 2 color hybs with 3 x replicates Also: some NON-microarray Gene Expression data for validation: Tech: SAGE (Riggins Lab @ Duke) Universal RNA sample Tech: Quantitative RT-PCR:Exprs. Meas. Center (Willey Lab) (100 genes)
Cross-Platform Probe Mapping:What gene is that? This is not easy…many ambiguities!!! Use: TIGR Resourcer Database of Microarray Probes Platform A Probe Sequence RefSEQ NM_67472.1 LocusLink 6366 Unigene Hs.875635 TIGR EST Database Platform B Probe Sequence
Log2(Intensity) Log2(Intensity) Ways of Visualizing Platform Comparisons Use: Tissue A Signal VS. Signal Tissue A / Tissue B Ratio VS. Ratio A > B = 2x 4x Log2(A/B) = Data for one gene Lines = 2 fold change Log2(A/B) Lines = 2 fold change A < B Used For: Compare Ratio On Two Platforms e.g. Affy (Liver/Spleen) vs. cDNA (Liver/Spleen) Compare Repeatability of Ratio on Platform e.g. cDNA (Liver1/Spleen1) vs cDNA (Liver2/Spleen2) Used For: Compare 2 One Color Affy Experiments e.g. Affy Liver1 vs Affy Liver2 Compare One Color Channel from 2 Two Color Hybs e.g. Liver1-Cy3 vs Liver2-Cy3 Compare One Cy Channel vs Affy One Color e.g. Cy3-Liver vs Affy Liver Also: Show Two Tissue Differential on One Platform e.g. Universal-Cy5 vs Liver-Cy3 in a 2 Color hyb e.g. Affy Universal vs. Affy Liver Ratio is Most Important Comparison: Signal from gene probe depends on platform. Ratio for gene should reflect ratio of transcripts, independent of platform (ideally!)
Typical Platform X Experiments: Kidney vs Universal RNA(normalized data) Affy ClonTech Agilent Amersham cDNA Operon
Typical START-PCR Data: START-PCR Kidney vs Univ Comparison Kidney Univ
Log2[ Kidney/Spleen -B ] Key To Statistical Measures Concept: High vs Low expression effect: Use brightest 10,000 or 5,000 probes [ 10k or 5k stat] Concept: All Gene vs Diff’l Gene effects: Use all probes or only 2x differential probes A Kidney/Spleen A vs B Compariosn Descriptive Stats Unc: Std dev fold diff N: Number of Genes Log2[ Kidney/Spleen -A ] R: Correlation Concordance % on 2x fold changes (A, B both say 2x vs A or B says 2x) % 2x fold changes where “anti-agree” (A says 2x , B say other way!)
Platform A vs Platform B (on Kidney/Spleen Ratio) [replicates averaged]
Platform A vs Platform B (on Kidney/Spleen Ratio) [replicates averaged]
Top 10,000 vs Top 5,000 vs Top 1000 Effect on Comparison Affymetrix vs Amersham Amersham vs Agilent
AAAAAA AAAAAA AAAAAA AAAAAA AAAAAA AAAAAA AAAAAA x x x x x x x x x x x x x x x Measuring Gene Expression: What is the Answer? “The Absolute Standards” For Comparison StaRT-PCR: RT-PCR with spike in reference standard for each gene + Sample with native PCR Target Spike in Reference (shorter) RT-PCR Calibrated Measurement SAGE: Transcript Counting via Sequence Tags ..GATTACA.. ..GATTACA.. ..GATTACA.. Ligate Tags Cut 14bp ID tags Sequence & Count Tags RNA Sample
Comparison’s To START-PCR:Here comes the judge…(?) 100 genes chosen for large, “mysterious”, disagreement between Affymetrix, Agilent, cDNA, SAGE Biased sample...
Repeatability: START vs START (on Kidney/Spleen Ratio) Revenge: Compare START to itself... START-PCR (~92 genes)
Affy Signal vs. Transcript Counting (SAGE) Sage Counts Sample = Universal Reference, pooled cell line RNA sample Stratagene 1000 Counts 256 Counts 64 Counts 16 Counts 4 Counts 2 Counts 1 Counts 0 Counts Log2[ Affy Signal ] (not seen in SAGE) Correlation = 0.45 (N = 13,173, all possible comparisons) Observe: Affy Signal-Count correlated for highly expressed transcripts, but (a) 100’s of Hi SAGE Count-Weak Affy Signal and (b) Affy detects many transcripts not seen by SAGE
Others: Compare to SAGE on Universal RNA Sample Agilent (Cy5 Channel) Amersham Affymetrix Potential Non-detection: low signal, HI SAGE count (pts in lower right)
Affy Detection P Value vs. Transcript Counting (SAGE) Sample = Universal Reference, pooled cell line RNA sample Stratagene Sage Counts >40 Counts Affy statistically “UN-detected” Genes 2 Counts 1 Counts 0 Counts (N=3832 with 0 cnt, 1472 Affy detected At strict P < 0.06) Affy Detected Genes Affy Detection P Value “Number of statisticallyundected genes in affy:” Number with > 20 Sage counts and Affy P > 0.09 = 29 10 92 5 222 2 835 1 1487 Up to P = 0.09 (N = 6287 in Affy) Consider as Detectable Observe: many “Affy Absent” genes are seen in sample via SAGE
Battle of the “Absolute Measurements”: SAGE vs START-PCR: Absolute Signal (Univ RNA) START-PCR R=0.57 R(>3 counts)=0.30 Who Judges the Judge? Log2[SAGE Counts] 0 1 2 3...32 counts
All using only Top 10,000 brightest probes Correlation (>2x Diffl Only) Summary Statistics Red = In Replicates % Agree on 2x Diff’l
Summary & Conclusions: …Lets Talk...