Introduction to Arson Analysis
Updated 4-15-09 for an arson homicide trial . (On the Web at www.denvergov.org/Crime_lab / est. 1-?-05/ 3-10-06). The original presentation was also found as a reference link at the AAFS and at Zeno’s Forensic Science Site est. 3-30-05/3-10-06. Introduction to Arson Analysis.

Introduction to Arson Analysis
E N D
Presentation Transcript
Updated 4-15-09 for an arson homicide trial (On the Web atwww.denvergov.org/Crime_lab/ est. 1-?-05/ 3-10-06) The original presentation was also found as a reference link at the AAFS and at Zeno’s Forensic Science Site est. 3-30-05/3-10-06 Introduction to Arson Analysis Arson Analysis by Gas Chromatography/Mass Spectrometry Denver Police Crime Laboratory William D. McDougall II Forensic Analyst (Retired) Original Presentation September 2004 wdmll@comcast.net
An abbreviated version of this PowerPoint presentation was given to a joint Denver Fire Department (Arson Bureau) and BATF Seminar for fire investigators (September 2004). This slide presentation has been expanded and will be upgraded as needed.
References and Credits A number of the graphic slides and annotations were obtained from the Internet. Many of the annotations and graphic displays have been altered (and added to), to highlight the present topic. I have displayed these slides in a progressive manner of complexity and I have tried to bridge slides of similar material so that it is easy to compare the material on different slides. Most of the mass data displays were obtained from a Varian Saturn 2000 Ion Trap Mass Spectrometer and a HP 5973 Mass Spectrometer in the Denver Police Crime Laboratory. M. Jennifer Thomas, Forensic Chemist, generated most of the mass data displays obtained from the HP 5973 Mass Spectrometer.
This HP GC/MSD is comprised of a HP 6890 GC interfaced to a HP 5972 Mass Selective Detector Quadrupole Mass Spectrometer. The system uses electron impact (EI) ionization and is capable of performing full mass scans or selective ion monitoring (SIM).
Gas Chromatograph-Ion Trap Mass Spectrometer (MS/MS) Injector > Control Panel Column Oven Ion Trap Gas Chromatograph Mass Spectrometer
Chromatography “chromato-graphy” means color writing It is a physical process of separating complex mixtures
The liquid (solvent or solvents) is the mobile phase THIN LAYER CHROMATOGRAPHY NON-POLAR Silica gel SiO2.H2O POLAR STATIONARY PHASE MEDIUM POLAR (On plastic, glass or foil backing) POLAR ( NON-POLAR, MEDIUM POLAR OR SOLVENT MIXTURE ) COLUMN CHROMATOGRAPHY ADSORPTION CHROMATOGRAPHY Interaction of the adsorptivity and solubility of the analytes relative to the two phases POLAR POLAR STATIONARY PHASE MEDIUM POLAR aluminum oxide Al2O3 (Less polar than silica) NON- POLAR Normal Phase Chromatography THE MORE POLAR COMPOUNDS MIGRATE SLOWER THAN LESS POLAR COMPOUNDS. NON-POLAR LIQUID MOBILE PHASES ARE USED IN THE MIGRATION OF LESS POLAR COMPOUNDS AND MEDIUM POLAR LIQUID MOBILE PHASES ARE USED IN THE MIGRATION OF MORE POLAR COMPOUNDS. THE RIGHT MIX OF SOLVENTS ( NON-POLAR AND MEDIUM POLAR OR MODIFIER ) IS NEEDED FOR THE MIGRATION AND SPEPARATION OF ALL THE POLAR ANALYTES . NON-POLAR COMPOUNDS MIGRATE AHEAD ( ELUTE FIRST ) OF THE POLAR COMPOUNDS.
MODERN HPLC SYSTEM API (ESI) CAN HAVE ONE OR MORE MOBILE PHASES M+1 CAN HAVE MORE THAN ONE PUMP Mass Spectra Controlled substances including “steroids” are excellent candidates for HPLC REVERSED PHASE HPLC THE STATIONARY PHASE IS HYDROPHOBIC (NON-POLAR). MODERATELY POLAR AND NON-POLAR COMPOUNDS START TO MIGRATE THROUGH THE COLUMN AS THE MOBILE PHASE CHANGES FROM AQUEOUS TO LESS POLAR ORGANIC SOLVENT. High pKa (basic) compounds will have a large k’ (longer retention time) in basic buffered mobile phases. Low pKa (acidic) compounds will have a large k’ in acidic buffered mobile phases. (Solvent Programming)
http://www.shu.ac.uk/schools/sci/chem/tutorials/chrom/gaschrm.htmhttp://www.shu.ac.uk/schools/sci/chem/tutorials/chrom/gaschrm.htm Gas Chromatography –The sample mixture is injected and vaporized. Next the mixture is transported through the heated column by the flow of an inert, gaseous mobile phase. The column contains a thin coating of a liquid stationary phasewhich differentially retards the migration of the sample components. After passing through the heated column, The separated sample components enter The detector causing an increase in the signal which is recorded as a peak for each component. The collection of peaks is called a chromatogram. The sample components have to be in the vapor state in order to pass through the column. < Pattern of peaks (Separated Components) (6)
The outside dimension of a capillary column is about the size of a heavy fishing line. The Column The Heart Of The Gas Chromatograph Columns for arson analysis are normally 15 to 30 meters in length.
A .25mm ID column is commonly use for arson analysis HP-5 Analyte> 5% phenyl methylpolysiloxane is a relatively non-polar general purpose stationary liquid phase < Air (Liquid stationary phase .25um thickness) tR "(ij c: 0> "in '- . 0 as (]) 0 Time A tenn called the retention factor, k', is often used to describe the migration rate of an analyte on a column. You may also find it called the capacity factor. The retention factor for analyte A is defined as; k'A = 1 R - 1M / 1M Non-retained Retained Chromatogram
DYNAMIC PARTITIONING TAKES PLACE IN GAS (LIQUID) CHROMATOGRAPHY Static Partitioning < BASIC AQUEOUS PHASE High pKa (basic) compounds such as cocaine and methamphetamine are found in higher concentrations in the lower phase after equilibration. < CHLOROFORM PHASE C stationary phase K= C mobile phase DYNAMIC PARTITIONING THE ANALYTES PARTITION BETWEEN THE STATIONARY LIQUID PHASE AND THE MOBILE GAS PHASE.
N= # of theoretical plates PACKED COLUMNS HAVE APPROX. 10,000 PLATES The column is made up of a large number of partitioning (separatory) zones Each partitioning zone equals one theoretical plate CAPILLARY COLUMNS HAVE APPROX 100,000 PLATES CAPILLARY COLUMNS HAVE MORE THEORETICAL PLATES THAN PACKED COLUMNS MINIBORE COLUMNS HAVE EVEN MORE THEORETICAL PLATES PER METER
(Used for packed columns) (CAPILLARY COLUMNS ARE NOT AFFECTED BY EDDY DIFFUSION) (CAPILLARY COLUMNS MINIMIZE THIS FACTOR) HYDROGEN IS USED AT HIGHER FLOW RATES THAN HELIUM. NITROGEN IS THE LEAST FAVORABLE. Carrier Gases NITROGEN, HELIUM AND HYDROGEN HAVE DIFFERENT SLOPES
Resolution In order to double the resolution, the column length has to be increased by a factor of four Resolution is proportional to the square root of (N), therefore the length of the column “SELECTIVITY” IS DETERMINED BY THE STATIONARY PHASE CHEMISTRY (K’) IS OPTIMIZED BY TEMPERATURE PROGRAMMING
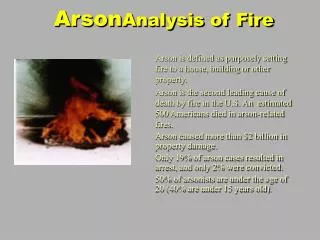
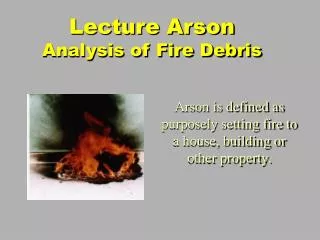
Fire Fire is a chemical reaction. It is rapid oxidation with the release of heat and Light (plus CO2 and water). In order for the reaction (fire) to happen, there needs to be an ignition source (a spark or friction), oxygen (air) and a fuel source (such as ignitable liquids).
(6) Carbons (14) Hydrogens Straight Chain METHANE HEXANE Normal Alkane Basic building block of hydrocarbons Cycloalkane METHYL- CYCLOHEXANE Branched Alkane 2-METHYLHEXANE (Isoparaffin) Found is gasohol and alcoholic drinks ETHANOL Thermo-Decomposition 1-HEXENE Thermo-Decomposition Oxygenated Solvent STYRENE ACETONE < Found in Gasoline > INDANE 1-METHYLINDAN Structures from NIST 98 version 1.6
BENZENE Basic building block of aromatic hydrocarbon compounds TOLUENE (6) Carbons (6) Hydrogens Benzene ring plus a methyl group C3 ALKYLBENZENE Hydrocarbons are fuel for arson fires and non-arson related fires ETHYLBENZENE (Reference Compound) 1,2,4-TRIMETHYLBENZENE NAPHTHALENE C4 ALKYLBENZENE HYDROCARBONS FOUND IN FIRE DEBRIS (Some of these compounds are found in both gasoline and thermo-decomposition). 1-METHYLNAPHTHALENE Structures from NIST 98 version 1.6
< Toluene Styrene and o-xylene have similar retention times. Each separated sample component is burnt in the flame causing an increase in the electrical signal. Styrene > THERMO- DECOMPOSITION (PYROLYSIS PRODUCTS) m/p -xylene Ethylbenzene > Each peak represents a compound from the original sample mixture. < m/p Each time the signal is increased it is recorded as a peak in the chromatogram. -xylene Time > > > Toluene followed by the other analytes enter the detector one after another, after migrating through the column. (Note in both chromatograms m/p-xylene co-elution) The analytes in these two chromatograms including styrene and o-xylene would superimpose Using the same time axis. < o-xylene < Toluene Ethylbenzene > < Chromatograms IGNITABLE LIQUID MIXTURE ( Separated Components ) Time > > > http://www.shu.ac.uk/schools/sci/chem/tutorials/chrom/gaschrm.htm
Gas Chromatography is used for separating compounds in complex mixtures (gasoline, kerosene and etc). The sample mixture is introduced into the heated injection port and an inert gas flowing through the system carries the compounds into the column. The material within the column is called the stationary phase (non-polar stationary phases are best for arson analysis) and the various sample components interact with this material to a greater or lesser degree. The greater the interaction, the slower that particular compound will move through the column. As the various components begin to migrate through the column, they undergo a series of equilibrium steps between the stationary phase and the mobile phase (the carrier gas) so that the separation becomes more pronounced as compounds progress through the column. In the ideal situation (the column length, flow rate and temperature are appropriate for the sample mixture), the differences in interaction are sufficient to allow all the components in the sample to be completely separated (I.e., resolved) from each other. However, you should note that as the compounds migrate through the column, each chromatographic peak, representing a sample component, broadens with increasing time in the column. The passage of three compounds through the column over time. Chromatogram ( Separated Components ) Time >> http://www.uga.edu/srel/AACES/GCtutorial/page1.html
The retention (retention time) of a compound depends not only on the column length, the type of stationary phase and flow rate, but also on the column temperature. As the temperature increases, compounds move through the column faster. Thus, one can reduce the analysis time by increasing (temperature programming) the column temperature. In this run the column temperature is increased from 40 C to 240 C at 10 C/ min during the analysis. All of the normal alkane components are completely separated into narrow symmetrical peaks. (Time of Elution) http://www.uga.edu/srel/AACES/GCtutorial/page1.html t (Retention Time) R < Peak Apex (Measured in Minutes) The retention time is the time a compound spends in the column from the time of injection to the time of elution of the compound (measured to the peak apex). < Time of Injection Time >>
AMU AMU Additional factors determining elution order and selectivity IN ORDER TO SEPARATE M-XYLENE AND P-XYLENE, A POLAR STATIONARY PHASE WOULD BE NEEDED. > In addition to molecular weight, molecular structure is a factor determining the boiling points, thus the order of elution. Time >>
Note the different profiles or patterns of peaks Kerosene Gasoline
Pattern recognition Chromatography peaks Diesel Fuel
Summery of gas chromatography (FID) used in fire debris analysis Gas chromatography – A gas carries the mixture through a column. The column is coated with a thin layer of a semi-liquid phase. The liquid phase retards the mixture based on boiling points and molecular weight (mass). The lighter components pass through the column first and the heavier components pass through the column last. As the components leave the column, they are burnt and ionized in the flame of the detector. The increased ionization produces an electrical signal that is sent to a recorder and displayed as a profile of peaks or a chromatogram. Each peak in the chromatogram is identified by its retention time. The overall pattern (chromatogram) can be compared to standard chromatograms (gasoline, kerosene, diesel and etc.). If the unknown sample displays a strong signal without background interference then the above is all that is needed. But most of the time, the signal is weak and there is background interference. Furthermore, if the unknown is weathered (ignitable liquids evaporate) then the pattern is altered and more difficult to identify. Background interference at times, can be falsely reported as ignitable liquids. A more definitive detector is needed. A mass spectrometer should be used to test fire debris cases. This type of detector produces mass spectra and extracted ion profiles in addition to chromatograms and retention times. The combination of all of these displays is a fingerprint for the identification of the ignitable liquid and the components in the ignitable liquid.
The Mass Detector The mass detector used in arson analysis is typically a Quadrupole or Ion Trap Mass Spectrometer.
Peak (component) Co-elution The preceding slides showed complex mixtures separated by chromatography. The separated components can be individually identified or class identified. But as shown in some of the previous slides, a number of the components were not separated. Peak co-elution is a frequent occurrence. There are a number of reasons including complexity of the mixture, the chemistry (chemical makeup of the stationary and /or mobile phases) of the separation process and the chemistry of the components in the mixture. The length of the column, temperature, the analysis time and other parameters affect the separation process. New advances in chromatography are improving the separation or isolation of components in complex mixtures resulting in reduced analysis time. Mass spectrometry carries out a second separation process. Mass spectrometry is used to ionize, fragment and filter the mixture component ions (after the mixture components pass through the column), producing mass spectra. Mass spectrometry computer algorithm techniques (Quadrupole and Ion Trap) use ion extraction algorithms to produce mass chromatograms. The algorithms isolate or extract ion information about the non-resolved and resolved (separated) components. Tandem mass spectrometry (MS/MS) uses multiple quadrupole mass filtering (MS/MS) or ion trapping (MS/MS in time). In addition to ionization and fragmentation, an ion pre-isolation process and collision-induced dissociationprecedes a secondary ion separation (filtering) and mass spectra formulation. New computer algorithms coupled with fast scanning detectors, such as time of flight mass spectrometry (TOF) perform peak deconvolution. Peak deconvolution, peak find algorithms plus automated library search routines, are used to extract (isolate) mass spectra, identify and confirm the presence of multiple component co-eluting compounds, in complex mixtures.
In addition to a profile of the separated components (chromatogram), the mass spectrometer produces a mass fragmentation pattern (mass spectrum) for each separated component (compound). Electron impact ionization (EI) produces positive ions, negative ions and neutral species. But only the positive ions are analyzed in this mode of analysis. The neutral species and molecules (not ionized), are pumped away. 1 = H+ 16 = O+ 17 = [OH]+ 18 = [H2O]+ In order to measure the mass of a compound it has to be ionized. The mass to charge ratio is actually determined. Normally the charge is one. The molecular ion is not stable using electron impact ionization (EI) and undergoes fragmentation. The fragmentation pattern is a display of intensity versus mass of the remaining molecular ion and the newly created fragment ions. Pressurized Vacuum Quadrupole filter Ion Trap Ionization & Fragmentation Quadrupole AC and DC Varied voltages The ions are scanned from the low masses to the high masses over time. < Mass Spectra Mixture Molecular ion > Separated Components (3) (3) 1=H+ 16=O+ 17=[OH]+ 18=[H2O]+ (3) http://ull.chemistry.uakron.edu/gcms/MS_detector/index.html http://www.jeolusa.com/ms/docs/whatisms.html
Gas Chromatograph-Ion Trap Mass Spectrometer (MS/MS) Extracted ion profiles of gasoline Gasoline Aromatics Toluene Toluene Pattern of peaks Indanes Toluene Naphthalenes Chromatogram (TIC) Aliphatics Mass Spectrum TIC The ions are scanned (separated) from the low masses to the high masses over time. An increasing RF (AC) voltage is used to filter the mass ions Injector > Sample syringe Control Panel Column Column Oven Ion Trap Gas Chromatograph Mass Spectrometer Supplemental wave forms (end-cap electrodes) can be used for MS/MS enhanced CID of ions 91,105,134 & etc. found in trace gasoline containing large amounts background interference patterns.
Mass Spectrometry Vacuum A high vacuum is needed to prevent unwanted collisions between the analyte ions and gas molecules during the migration of the ions from the source, through the analyzer and to the detector. The necessary “mean free path” is achieved with a vacuum of approximately torr or less. A mechanical low vacuum pump and a high vacuum pump (diffusion or turbo) are coupled to achieve the high vacuum. The ion trap needs a partial vacuum (approximately 1 millitorr of helium) to dampen the kinetic energy of the ions in order to stabilize their trajectories. Collision-induced dissociation used in MS/MS also needs increased gas pressure (a neutral gas).
The sample molecules are ionized, fragmented and trapped. The RF voltage is ramped and the ions from the lowest mass to the highest mass (with unit resolution), are ejected from the analyzer and detected by the detector. (Electron impact ionization) (End-cap) (Ring) Separated components enter here > (End-cap) http://ull.chemistry.uakron.edu/gcms/MS_detector/index.html
After the positive ions pass through the mass analyzer with unit resolution, they are detected as an amplified electrical signal. http://ull.chemistry.uakron.edu/gcms/MS_detector/index.html
For each positive ion that strikes the inner surface, a gain of approximately one million electrons is produced. http://ull.chemistry.uakron.edu/gcms/MS_detector/index.html
Ion Trap Analyzer Showing the different electrical potentials applied to the ion trap (Electron impact ionization) With additional wave form manipulations applied to the End-cap electrodes, MS/MS can be used to further analyze fire debris containing matrices. (Figure taken from www.ivv.fhg.de/ms/ms-analyzers.html#Ion_Trap
Special Note! Advanced quadrupole mass spectrometry applications use tandem mass spectrometry in space or time. Multiple quadrupole mass filters in series or a single quadrupole ion trap mass spectrometer (in time), are used to isolate one or more parent ions (MRM) which are subjected to “collision-induced dissociation”. The newly formed ions are called product ions. The product ions and remaining parent ions are then mass filtered to produce mass spectra and mass chromatograms (minus background interference). This application can be useful in arson analysis as a compliment to single quadrupole mass spectrometry. This technique can remove extra artifact peaks found in extracted ion profiles (mass chromatograms) of ignitable liquids containing complex background interference. Tandem mass spectrometry is used in a number of applications including both gas chromatography/mass spectrometry and high performance liquid chromatography/mass spectrometry.
(Ion Trap and Quadrupole Mass Filter) (Ion trap) Waters Corporation These equations are used for both the Quadrupole Mass Filter and The Ion Trap (For the Ion Trap) (DC=0V for the Ion Trap) (The Quadrupole Mass Filter uses both DC and RF voltages)
The AC frequency is about one megahertz and is called the fundamental RF. It is applied to the ring electrode. DC = 0V a z (RF) q Z ^ | | The larger the mass the smaller the A constant RF voltage is used to trap the ions q z q The instability along the (RF) axis is expressed as z Trajectory of a single ion > a DC z q 0.9 > (unstable) z q RF z Resonance allows an ion to escape Before q > 0.9 q c RF z O z m The larger the RF voltage the larger the q (The RF voltage is ramped (> 6000 V) to destabilize the ion trajectories) Z (The frequency of the AC applied to the end-caps is approximately ½ of the fundamental RF) Also called axial modulation (When the secular frequency of an ion is equal to the end-caps’ frequency it undergoes resonance) (The AC voltage applied to the end-caps is approximately 3 V) (Secular Frequency: frequency at which an ion oscillates in the trap) The secular frequency is dependent on the q z value
Comparative diagram, roughly to scale, of a quadrupole mass filter and a cutaway view of a quadrupole ion trap mass analyzer. http://www.abrf.org/ABRFNews/1996/September1996/sep96iontrap.html
Quadrupole mass spectrometers consist of an ion source, ion optics (lenses) to accelerate and focus the ions through an aperture into the quadrupole filter, the quadrupole filter itself with control voltage supplies, an exit aperture, an ion detector, detection electronics, and a high-vacuum system. Schematic of a quadrupole filter The ions are scanned (stabilized) from the lowest mass to the highest mass (with unit resolution) through the quadrupole filter and detected by the detector. (RF voltage) http://www.chem.vt.edu/chem-ed/ms/quadrupo.html RLC circuits are designed as high pass filters (high frequencies) and as low pass filters (low frequencies) in many types of applications. http://avogadro.chem.iastate.edu/CHEM577/CHEM577-C.pdf
DC and RF voltages (+) Rods RF DC (-) Rods http://www.chm.uri.edu/chm412/Chap11.ppt The Quadrupole mass analyzer consists of four cylindrical rods onto which are applied both RF and DC electrical fields. These four rods are arranged in such a manner that they form one pair in the X plane, and one in the Y plane. As ions enter the Quadrupole, they begin to oscillate in both the X and Y planes, thus causing the lower m/e ions to be destabilized in the Quadrupole whenever the alternating (RF) component of the electric field exceeds the direct (DC) component. In this condition, the lower m/e ions will be thrown out of the Quadrupole and not reach the detector, thereby creating an effective high pass filter. If the direct component exceeds the alternating component then the high m/e ions become unstable, while the lower m/e will be stabilized by the presence of the alternating component making for an effective low pass filter. In the Quadrupole system, the mass analyzer is created by connecting the two pairs of rods in such a manner that the positive pair acts as a high pass filter and the negative pair acts as a low pass filter. By carefully matching the two fields, only ions of a particular mass are able to resonate at the correct frequency allowing them to pass through the Quadrupole at any time. In this regard, the Quadrupole mass analyzer is a very fast and efficient system. http://www.elementalanalysis.com/icp/
http://www.chm.uri.edu/chm412/Chap11.ppt Heavy ions pass through the rods + DC Potential RF >DC RF Potential ( Light ions are destabilized and lost.) - DC Potential > DC >RF Positive Ions Heavy ions drift in to the negative rods. http://avogadro.chem.iastate.edu/CHEM577/CHEM577-C.pdf (Attracts all ions) RF Potential (Light ions pass through the rods) (All ions repelled) The proper ratio of DC and RF potentials results in unit resolution. Band Filter
The AC voltage has a frequency in the radio frequency range (RF) Small ion RF>DC (+) Rods High pass filter Large ion DC>RF (-) Rods Low pass filter High and low pass filters combined Become a narrow band filter allowing ions of the same mass/charge to pass through to the detector. The combination of the high pass filtering rods and the low pass filtering rods produce a narrow band filter. With the proper DC to RF ratio, unit mass resolution is achieved. The fixed DC/RF ratio is ramped (DC and RF voltages are increased linearly), allowing all of the ions starting with low mass to high mass (with unit resolution), to pass through the rods to the detector over time. One scan in approx ½ second. (RF)
A RLC circuit is used as a tuner for old style radios. When the resonance frequency of a radio tuning circuit matches the broadcast frequency of a radio station, the circuit is “tuned in” to that radio station. Variable capacitors and inductors are used to make the adjustment to the circuit to maximize the signal. http://www.kineticbooks.com/physics/17296/17329/sp.html (RF) The ratio of the DC and RF voltages is adjusted to produce unit mass resolution. The magnitudes of the two voltages (in a fixed ratio) are ramped through the entire mass range. A calibration gas is used to tune and calibrate the mass spectrometer. Masses (69,219 & 502) are tuned by choosing the proper DC to RF ratio to achieve unit resolution (scan-line). Next the unit resolved mass peaks are assigned masses from a calibration table.
Unit resolution < v From NIST 98 version 1.6 Tune and Calibration In addition to unit resolution and mass calibration, relative intensities are obtained. Library mass spectral searches of unknown mass spectra are now possible.
Electron Impact Ionization (70 electron volts) The below ion fragmentation patterns are a function of molecular structure The energy needed to break the bonds in the above classes of hydrocarbons is much less than 70 electron volts. However, to maximize total ion current sensitivity and produce ion fragmentation patterns that are library searchable, 70 electron volts are the standard for electron impact ionization. (Approximately 5 eV will break a carbon, carbon single bond)
~ Next the components are ionized by electron impact (EI) and undergo fragmentation. Separated Components Filament < Toluene Mass Filter The ions are scanned (filtered) from the lowest mass to the highest mass with unit resolution. The ions strike the detector and are recorded as a mass spectrum. > ^ Lenses accelerate and focus the ions Separated by chromatography Toluene The ramp display to the left is for the positive set of rods. The negative set of rods have an equal negative DC slope and a RF 180 degrees out of phase. Mass Spectrum http://ull.chemistry.uakron.edu/gcms/MS_detector/index.html http://chipo.chem.uic.edu/web1/ocol/spec/MS1.htm
The mass spectrum of toluene (methyl benzene) is shown below. The spectrum displays a strong 92 molecular ion, a 91 base peak and an assortment of minor peaks m/z = 65 and below (fragmentation ions). -------------------------------- Toluene http://chipo.chem.uic.edu/web1/ocol/spec/MS1.htm
The mass spectrum is a graph of intensity versus mass/charge (m/z). The most intense ion in the mass spectrum is called the base peak (displayed as 100%) and the other fragmentation ions are displayed relative to the base peak. The highest molecular weight ion in the mass spectrum normally represents the parent molecule (with an electron removed) and is called the molecular ion (M+). Note below, as the alkyl side chain increases, the molecular ion decreases in relative intensity (see toluene in the last slide). http://chipo.chem.uic.edu/web1/ocol/spec/MS1.htm Ethylbenzene Ethylbenzene http://science.csustan.edu/tutorial/mass/ethyben5.htm