Download
1 / 15
150 likes | 187 Views
Learn about correlation coefficients, scatter diagrams, and measures of correlation between variables. Understand how to interpret correlation values and factors affecting correlation strength. Explore correlation vs. causation concepts.

E N D
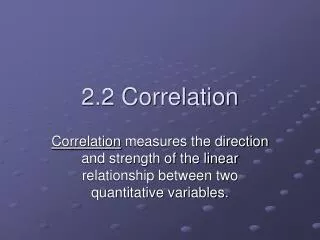
Measures of the relationship between 2 variables: Correlation Chapter 16
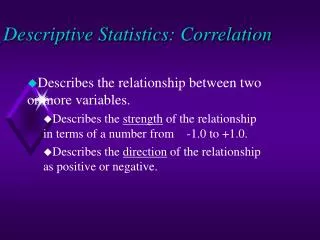
Correlation Coefficient • Descriptive statistic • degree of relationship between 2 variables • 2 dependent variables • if we know value of 1 variable… how well can we predict value of other • Values of correlation coefficient • between -1 and +1 • 0 = no relationship ~
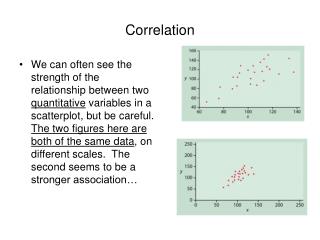
Scatter Diagrams • Also called scatter plots • 1 variable: Y axis; other X axis • makes no difference which way • plot point at intersection of values • look for trends • e.g., height vs shoe size ~
6 7 8 9 10 11 12 Scatter Diagrams 84 78 Height 72 66 60 Shoe size
Correlation Coefficient Values • Sample statistic: r • population parameter: r (rho) • values: -1 <r < +1 • Scatter diagram characteristics • slope & width • determines value of r ~
Slope & value of r • Determines sign • positive or negative • From lower left to upper right • positive ~
Slope & value of r • From upper left to lower right • negative ~
Width & value of r • Magnitude of r • draw imaginary ellipse around most points • Narrow: r near -1 or +1 • strong relationship between variables • Wide: r near 0 • little or no relationship between variables ~
300 300 250 250 Weight Weight 200 200 150 150 3 3 6 6 9 9 12 12 15 15 18 18 21 21 100 100 Chin ups Chin ups Width & value of r Weak relationship Strong negative relationship r near 0 r near -1
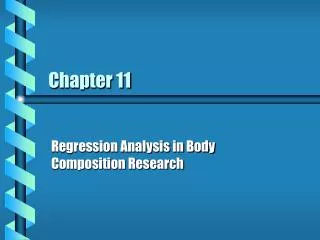
Measures of Correlation • Several different measures • depends on level of measurement • Pearson’s r • interval/ratio • Spearman’s rs • ordinal and interval/ratio • Others for nominal and different combinations of levels of measurement ~
Factors that affect size of r • Nonlinear relationships • Pearson’s r does not detect more complex relationships • r near 0 ~ Y X
Factors that affect size of r • Range restriction • eliminate values from 1 or both variable • r is reduced • e.g. eliminate people under 72 inches ~
Correlation and Causation • Causation requires correlation, but... • Correlation does not imply causation! • Does not mean 1 variable causes changes in the other • e.g. # of household appliances negatively correlated with family size • appliances as effective birth control? • Changes may be caused by a third unknown variable ~