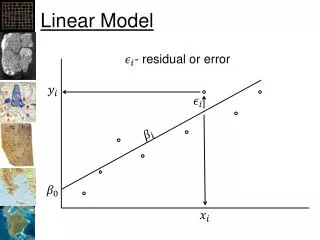
Linear Model Selection and regularization
Linear Model Selection and regularization. Chapter 06 Disclaimer: This PPT is modified based on IOM 530: Intro. to Statistical Learning. Outline. Subset Selection Best Subset Selection Stepwise Selection Choosing the Optimal Model Shrinkage Methods Ridge Regression The Lasso.

Linear Model Selection and regularization
E N D
Presentation Transcript
STT592-002: Intro. to Statistical Learning Linear Model Selection and regularization Chapter 06 Disclaimer: This PPT is modified based on IOM 530: Intro. to Statistical Learning
STT592-002: Intro. to Statistical Learning Outline • Subset Selection • Best Subset Selection • Stepwise Selection • Choosing the Optimal Model • Shrinkage Methods • Ridge Regression • The Lasso
STT592-002: Intro. to Statistical Learning Improving on the Least Squares Regression Estimates? • We want to improve the Linear Regression model, by replacing the least square fitting with some alternative fitting procedure, i.e., the values that minimize the mean square error (MSE) • There are 2 reasons we might not prefer to just use the ordinary least squares (OLS) estimates • Prediction Accuracy • Model Interpretability
STT592-002: Intro. to Statistical Learning 1. Prediction Accuracy • The least squares estimates have relatively low biasand low variability especially when the relationship between Y and X is linear and the number of observations n is way bigger than the number of predictors p • But, when , then the least squares fit can have high variance and may result in over fitting and poor estimates on unseen observations, • And, when , then the variability of the least squares fit increases dramatically, and the variance of these estimates in infinite
STT592-002: Intro. to Statistical Learning 2. Model Interpretability • When we have a large number of variables X in the model there will generally be many that have little or no effect on Y • Leaving these variables in the model makes it harder to see the “big picture”, i.e., the effect of the “important variables” • The model would be easier to interpret by removing (i.e. setting the coefficients to zero) the unimportant variables
STT592-002: Intro. to Statistical Learning Solution • Subset Selection • Identifying a subset of all p predictors X that we believe to be related to the response Y, and then fitting the model using this subset • E.g. best subset selection and stepwise selection • Shrinkage • Involves shrinking the estimates coefficients towards zero • This shrinkage reduces the variance • Some of the coefficients may shrink to exactly zero, and hence shrinkage methods can also perform variable selection • E.g. Ridge regression and the Lasso • Dimension Reduction • Involves projecting all p predictors into an M-dimensional space where M < p, and then fitting linear regression model • E.g. Principle Components Regression
STT592-002: Intro. to Statistical Learning 6.1 Subset selection
STT592-002: Intro. to Statistical Learning 6.6.1 Best Subset Selection • In this approach, we run a linear regression for each possible combination of the X predictors • How do we judge which subset is the “best”? • One simple approach is to take the subset with the smallest RSS or the largest R2 • Unfortunately, one can show that the model that includes all the variables will always have the largest R2 (and smallest RSS)
STT592-002: Intro. to Statistical Learning Credit Data: R2 vs. Subset Size • The RSS/R2 will always decline/increase as the number of variables increase so they are not very useful • The red line tracks the best model for a given number of predictors, according to RSS and R2
STT592-002: Intro. to Statistical Learning Other Measures of Comparison • To compare different models, we can use other approaches: • Adjusted R2 • AIC (Akaike information criterion) • BIC (Bayesian information criterion) • Cp (equivalent to AIC for linear regression) • These methods add penalty to RSS for the number of variables (i.e. complexity) in the model • None are perfect
STT592-002: Intro. to Statistical Learning Credit Data: Cp, BIC, and Adjusted R2 • A small value of Cp and BIC indicates a low error, and thus a better model • A large value for the Adjusted R2 indicates a better model
STT592-002: Intro. to Statistical Learning 6.1.2 Stepwise Selection • Best Subset Selection is computationally intensive especially when we have a large number of predictors (large p) • More attractive methods: • Forward Stepwise Selection: Begins with the model containing no predictor, and then adds one predictor at a time that improves the model the most until no further improvement is possible • Backward Stepwise Selection: Begins with the model containing all predictors, and then deleting one predictor at a time that improves the model the most until no further improvement is possible
STT592-002: Intro. to Statistical Learning 6.2 Shrinkage Methods
STT592-002: Intro. to Statistical Learning 6.2.1 Ridge Regression • Ordinary Least Squares (OLS) estimates by minimizing • Ridge Regression uses a slightly different equation
STT592-002: Intro. to Statistical Learning Ridge Regression Adds a Penalty on ! • The effect of this equation is to add a penalty of the form Where the tuning parameter is a positive value. • This has the effect of “shrinking” large values of towards zero. • It turns out that such a constraint should improve the fit, because shrinking the coefficients can significantly reduce their variance • Notice that when = 0, we get the OLS!
STT592-002: Intro. to Statistical Learning Credit Data: Ridge Regression • As increases, the standardized coefficients shrinks towards zero.
STT592-002: Intro. to Statistical Learning Why can shrinking towards zero be a good thing to do? • It turns out that the OLS estimates generally have low bias but can be highly variable. In particular when n and p are of similar size or when n < p, then the OLS estimates will be extremely variable • The penalty term makes the ridge regression estimates biased but can also substantially reduce variance • Thus, there is a bias/ variance trade-off
STT592-002: Intro. to Statistical Learning Ridge Regression Bias/ Variance • Black: Bias • Green: Variance • Purple: MSE • Increase increases bias but decreases variance
STT592-002: Intro. to Statistical Learning Bias/ Variance Trade-off • In general, the ridge regression estimates will be more biased than the OLS ones but have lower variance • Ridge regression will work best in situations where the OLS estimates have high variance
STT592-002: Intro. to Statistical Learning Computational Advantages of Ridge Regression • If p is large, then using the best subset selection approach requires searching through enormous numbers of possible models • With Ridge Regression, for any given , we only need to fit one model and the computations turn out to be very simple • Ridge Regression can even be used when p > n, a situation where OLS fails completely!
STT592-002: Intro. to Statistical Learning 6.2.2. The LASSO • Ridge Regression isn’t perfect • One significant problem is that the penalty term will never force any of the coefficients to be exactly zero. Thus, the final model will include all variables, which makes it harder to interpret • A more modern alternative is the LASSO • The LASSO works in a similar way to Ridge Regression, except it uses a different penalty term
STT592-002: Intro. to Statistical Learning LASSO’s Penalty Term • Ridge Regression minimizes • The LASSO estimates the by minimizing the
STT592-002: Intro. to Statistical Learning What’s the Big Deal? • This seems like a very similar idea but there is a big difference • Using this penalty, it could be proven mathematically that some coefficients end up being set to exactly zero • With LASSO, we can produce a model that has high predictive power and it is simple to interpret
STT592-002: Intro. to Statistical Learning Credit Data: LASSO
STT592-002: Intro. to Statistical Learning 6.2.3 Selecting the Tuning Parameter • We need to decide on a value for • Select a grid of potential values, use cross validation to estimate the error rate on test data (for each value of ) and select the value that gives the least error rate