Download
1 / 21
210 likes | 411 Views
Verification of Predictive Modeling in the Management of Rare, Chronic Diseases. Jason Cooper 1 , M.S.; Daryl Wansink 2 , Ph.D.; Alexander Marano 1 1 Accordant Health Services; 2 Independence Blue Cross. Outline. Background Objectives Methodology Results Next Steps Q&A. Background.

E N D
Verification of Predictive Modeling in the Management of Rare, Chronic Diseases Jason Cooper1, M.S.; Daryl Wansink2, Ph.D.; Alexander Marano11Accordant Health Services; 2Independence Blue Cross
Outline • Background • Objectives • Methodology • Results • Next Steps • Q&A
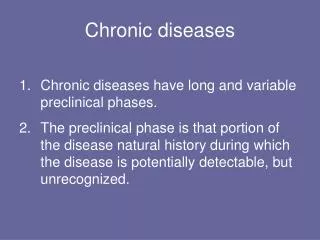
Background • Accordant Health Services is a Disease Management Organization (DMO) that specializes in managing chronic conditions for two primary categories: • Common (Asthma, CAD, CHF, COPD, and Diabetes) • Rare (ALS, CF, CIDP, Crohn’s, Gaucher, Hemophilia, Lupus, MS, Myasthenia Gravis, Myositis, Parkinson’s, RA, Scleroderma, Sickle Cell disease, and Seizure disorders) • Independence Blue Cross (IBC) is a Managed Care Organization (MCO) headquartered in Philadelphia, PA. • Approximately 3.4 million insured members • Utilize Accordant’s services as a provider of rare disease management
Objectives • Study Symmetry’s Episode Treatment Group (ETG) and Episode Risk Group (ERG) predictive modeling tools for analyses of IBC’s members and determination of risk relevance to rare, chronic population • Determine statistically relevant risk category groupings • Consider how best to incorporate results for novel approaches to clinical intervention strategies
Methodology • Matched member approach: IBC eligible members in Accordant rare program for at least nine months of each study year • Model year: 10/01/05 – 09/30/06. Used to generate prospective risk scores for each member • Verification Year: 10/01/06 – 09/30/07. Used to determine cost and utilization totals to verify Symmetry’s risk scores • For all matched members: • Medical Claims • Rx Claims • Diagnosis (Primary Managed Condition)
Methodology (cont.) • Originally considered five diagnosis groups: • Gastroenterology (n = 0): Crohn’s • Hematology (n = 79): Gaucher, Hemophilia, Sickle Cell disease • Neurology (n = 2711): ALS, CIDP, Myasthenia Gravis, MS, Parkinson’s, and Seizures • Pulmonary (n = 50): Cystic Fibrosis • Rheumatology (n = 2430): Lupus, Myositis, RA, and Scleroderma • Crohn’s not included in later study stages due to null population (a new program for IBC) • Hematology and pulmonary not included in later study stages due to low ‘n’ size and higher statistical variability
Count of Members • N = 5,270 • Count of Members by Diagnosis Diagnosis
Count of Members • N = 5,270 • Count of Members by Risk Category • Red lines indicate ‘Low’, ‘Moderate’, and ‘High’ Risk Category – 2005 Model Year
Average MedPaid – 2006 Verification Year • N = 5,270 • Average MedPaid by Risk Category • Red lines indicate ‘Low’, ‘Moderate’, and ‘High’ Risk Category – 2005 Model Year
Average Admits – 2006 Verification Year • N = 5,270 • Average Admits by Risk Category • Red lines indicate ‘Low’, ‘Moderate’, and ‘High’ Risk Category – 2005 Model Year
Average MedPaid – 2006 Verification Year • N = 2,711 • Average MedPaid by Risk Category • Red lines indicate ‘Low’, ‘Moderate’, and ‘High’ Risk Category – 2005 Model Year
Average Admits – 2006 Verification Year • N = 2,711 • Average Admits by Risk Category • Red lines indicate ‘Low’, ‘Moderate’, and ‘High’ Risk Category – 2005 Model Year
Average MedPaid – 2006 Verification Year • N = 2,430 • Average MedPaid by Risk Category • Red lines indicate ‘Low’, ‘Moderate’, and ‘High’ Risk Category – 2005 Model Year
Average Admits – 2006 Verification Year • N = 2,430 • Average Admits by Risk Category • Red lines indicate ‘Low’, ‘Moderate’, and ‘High’ Risk Category – 2005 Model Year
Non-Parametric AnalysesKruskal-Wallis Tests • H0: The mean ranks of [Medical Paid Amounts, Admits, ER Visits] are equivalent amongst the [Risk Categories]. • H1: The mean ranks of [Medical Paid Amounts, Admits, ER Visits] are significantly different amongst the [Risk Categories].
Aggregate Neuro Rheuma (n=5270) (n=2711) (n=2430) MedPaid p < 0.05 p < 0.05 p < 0.05 Admits p < 0.05 p < 0.05 p < 0.05 ER Visits p > 0.05 p < 0.05 p > 0.05 Kruskal-Wallis Tests • Defined Risk Categories (based on Symmetry’s Prospective Risk): • Lower (Risk < 13) • Moderate (13 ≥ Risk ≤ 19) • Higher (Risk > 19)
Conclusions • Symmetry’s risk categories were verified against IBC’s rare, chronic study population • Prospective risk appears to identify those members with a higher likelihood of increased medical spend and/or utilization • Determined significant difference in groups of risk (Low, Moderate, High) • Established that Symmetry captures both rare condition diagnoses and non-diagnoses related episodes of care
Next Steps • Additional analyses to consider correlations between member’s participation status and risk, as well as a member’s level of acuity and risk • Determine relevant segmentation for impacting clinical intervention strategies: • Common traits of risk inclined members • Exclusionary parameter considerations • Collaborate with Clinical Operations to develop a segmentation strategy • Pilot a prospective study to measure segmentation strategy impact
Questions? Thank You... • JCooper@accordant.net • Daryl.Wansink@ibx.com • AMarano@accordant.net