Box-and-Whisker Plots
50 likes | 372 Views
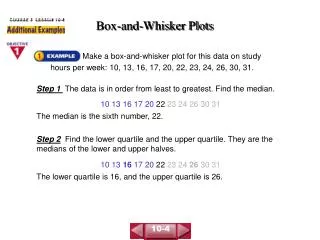
COURSE 3 LESSON 10-4. Box-and-Whisker Plots. Make a box-and-whisker plot for this data on study hours per week: 10, 13, 16, 17, 20, 22, 23, 24, 26, 30, 31. Step 1 The data is in order from least to greatest. Find the median. 10 13 16 17 20 22 23 24 26 30 31

Box-and-Whisker Plots
E N D
Presentation Transcript
COURSE 3 LESSON 10-4 Box-and-Whisker Plots Make a box-and-whisker plot for this data on study hours per week: 10, 13, 16, 17, 20, 22, 23, 24, 26, 30, 31. Step 1 The data is in order from least to greatest. Find the median. 10 13 16 17 20 22 23 24 26 30 31 The median is the sixth number, 22. Step 2 Find the lower quartile and the upper quartile. They are the medians of the lower and upper halves. 10 13 16 17 20 22 23 24 26 30 31 The lower quartile is 16, and the upper quartile is 26. 10-4
Step 3 Draw a number line that spans all of the data values. Mark points below the number line at the least and greatest values, at the median, and at the lower and upper quartiles. Mark the median. Use the lower and upper quartiles to form a box. Then draw whiskers from the box to the least and greatest values. COURSE 3 LESSON 10-4 Box-and-Whisker Plots (continued) 10-4
COURSE 3 LESSON 10-4 Box-and-Whisker Plots Write a paragraph to compare the data shown in these plots. The median attendance for football, around 1,750, is over four times the median for soccer, 400. The range for soccer is 2,600, which is larger than the range for football. Attendance for football is more tightly grouped around the median than for soccer. 10-4
COURSE 3 LESSON 10-4 Box-and-Whisker Plots 1. Describe the following box-and-whisker plot. 2. Make box-and-whisker plots on a single number line to compare the individual points scored by boys and girls. Girls: 14, 15, 18, 20, 21, 21, 24, 24, 25, 27, 29 Boys: 8, 8, 9, 10, 14, 18, 25, 25, 28, 28, 30 lower quartile is 8, upper quartile is 14, median is 10, whiskers extend to 6 and 18 10-4


