Download
1 / 7
70 likes | 238 Views
Ms. Maes ’ classroom looks out over one of the school’s parking lots. Her class made a bar graph at the right of the colors of the vehicles parked in the lot. Does the bar graph show categorical or numerical data? Explain. The bar graph shows categorical data. Colors are categories.

E N D
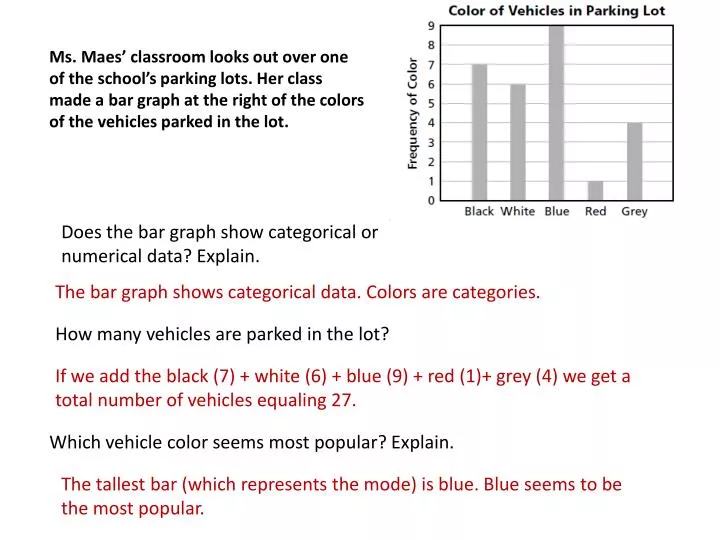
Ms. Maes’ classroom looks out over one of the school’s parking lots. Her class made a bar graph at the right of the colors of the vehicles parked in the lot. Does the bar graph show categorical or numerical data? Explain. The bar graph shows categorical data. Colors are categories. How many vehicles are parked in the lot? If we add the black (7) + white (6) + blue (9) + red (1)+ grey (4) we get a total number of vehicles equaling 27. Which vehicle color seems most popular? Explain. The tallest bar (which represents the mode) is blue. Blue seems to be the most popular.
Line Plot: How many students are in Mr. Samuel’s class? How do you know? There are 25 students in his class. I know because an x represent one student. What is the median name length of this class? The median (middle number in an ordered set) is 12. It is where the middle x is located. How many students had a name length smaller that 12 letters? Values that are smaller than 12 are 11, 10, and 9… we add 6 x’s +1x + 4x’s to get a total of 11 kids with names shorter than 12 letters.
Collect Data Please roll the dice 10 times. Record/Organize your data in a Frequency Distribution Chart. Make a Bar Graph and Line Plot of your data. Find the measures of central tendency (range, mean, median, and mean).
Double Bar Graph Stacked Bar Graph