Download

1 / 74
740 likes | 852 Views
Epidemiology of Hypertension. Stanley S. Franklin, MD, FACP, FACC Clinical Professor of Medicine University of California at Irvine Associate Medical Director UCI Heart Disease Prevention Program Irvine, California. Agenda: epidemiology of hypertension. BP measurement

E N D
Epidemiology of Hypertension Stanley S. Franklin, MD, FACP, FACC Clinical Professor of Medicine University of California at Irvine Associate Medical Director UCI Heart Disease Prevention Program Irvine, California
Agenda: epidemiology of hypertension • BP measurement • Defining hypertension • Why an important public health problem • Global risk assessment • Intervention trials and meta-analyses • Management strategies • Barriers to treatment • Prevention strategies
1. How to measure blood pressure?
Ascultatory method of blood pressure measurement Nokolai Korotkoff, 1905
Noninvasive Blood Pressure Measurement Methodologies Auscultatory (K sound) - Mercury - Aneroid - Oscillometric Locations Situations - Upper arm - Clinic - Wrist - Home - Finger - Ambulatory
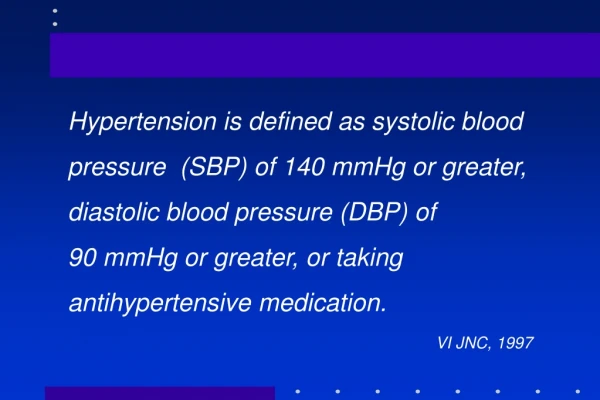
2. Defining Hypertension: (a) By the numbers? ≥95 DBP 160/95 140/90 130/85 >120/80 “A number at which the benefits of intervention exceed those of inaction”
CV Mortality Risk Doubles withEach 20/10 mm Hg BP Increment* 8 7 6 5 CVmortalityrisk 4 3 2 1 0 115/75 135/85 155/95 175/105 SBP/DBP (mm Hg) *Individuals aged 40-70 years, starting at BP 115/75 mm Hg. CV, cardiovascular; SBP, systolic blood pressure; DBP, diastolic blood pressure Lewington S, et al. Lancet. 2002; 60:1903-1913. JNC 7. JAMA. 2003;289:2560-2572.
and <120 80 Optimal and Normal <120 80 and 120-129 80-84 Normal or Prehypertension 120-139 80-89 or 130-139 85-89 Hi-normal Hypertension or 140-159 90-99 or Stage 1 Stage 1 140-159 90-99 or Stage 2 160-179 100-109 or ≥160 ≥100 Stage 2 Stage 3 ≥180 or ≥110 JNC Reclassification of BP Based on Risk JNC VI JNC 7 DBP (mm Hg) SBP (mm Hg) DBP (mm Hg) SBP (mm Hg) Category Category Source for JNC VI: Arch Intern Med. 1997;157:2413-2446. Adapted with permission from Chobanian AV et al. Hypertension. 2003;42:1206-1252.
Prevalence of Blood Pressure Categories in US Adults ≥20 Years of Age (NHANES 1999-2000) Greenland, Croft, Mensah (CDC). Arch Intern Med. 2004;164:2113f
Prehypertension … • Is not a disease, • Is not “hypertension”, • Is not an indication for drug treatment of HTN, • Does not have a BP goal, • Does predict a higher risk for developing CV events, • Does predict a higher risk for developing HTN, • Should be an incentive to improve lifestyle practices for prevention of HTN and CVD.
Defining Hypertension: (b) By hemodynamic mechanism? Increased peripheral vascular resistance versus Increased large artery stiffness
Systolic pressure Dicrotic notch (aortic valve closes) 125 Mean pressure Pressure (mm Hg) Diastolic decay curve Diastolic pressure 75 Time The Arterial Pulse Wave Pulse pressure =1/3 SBP + 2/3 DBP
Hemodynamic Components of BP • MAP - STEADY COMPONENT (due to CO and SVR) •PP – PULSATILE COMPONENT(due to LV ejection and elastic artery stiffness) • SBP –rises with increased resistance and stiffness •DBP –rises with increased resistance and decreases with increased stiffness Elzinga G, Westerhof N. Circ Res 1973;32:178-186. Yano, et al. Basic Res Cardiol 1997;92:115-122. Berne RM, Levy MN. Cardiovascular Physiology 1992:135-151.
Steady component MAP = CO x PVR ↑Resistance small art. MAP = 1/3(SBP) + 2/3(DBP) Predominantly diastolic “Essential HTN”--young -- ↑VC or ↓VD responses -- ↑wall-to-lumen diameter -- Rarefaction (Art./Cap.) 2. Pulsatile component PP = SBP – DBP ↑Stiffness large arteries ↑CO and ↑SV Isolated systolic HTN Pathologic aging -- Disarray of elastin protein -- Abn. extracellular matrix -- ↑Collagen/Calcium depos. Overview of Arterial Blood Pressure Hemodynamics
Defining Hypertension: (c) By subtype? IDH, SDH, ISH
Distribution of Hypertension Subtype in the Untreated Hypertensive Population by Age (NHANES III) ISH (SBP ³140 mm Hg and DBP <90 mm Hg) SDH (SBP ³140 mm Hg and DBP ³90 mm Hg) IDH (SBP <140 mm Hg and DBP ³90 mm Hg) 100 80 60 40 20 0 } Diastolic Hypertension 17% 16% 16% 20% 20% 11% Frequency of hypertension subtypes in all untreated hypertensives (%) <40 40-49 50-59 60-69 70-79 80+ Age (y) Numbers at top of bars represent the overall percentage distribution of untreated hypertension by age. Franklin et al. Hypertension. 2001;37: 869-874.
An Analysis of NHANES III Blood Pressure Data Summary:Hypertensives fall into one of two categories: 1. A smaller (26%), younger (age 50 years), predominantly male (63%) with diastolic hypertension out of proportion to systolic hypertension (primarily IDHand SDH) 2. A larger (74%), older (age 50 years), predominantly female (58%) with systolic hypertension out of proportion to diastolic hypertension (primarily ISH). Franklin et al. Hypertension 2001;37: 869-874
3. Why is hypertension considered a major Public health problem in the United States? Firstly, hypertension is very common In the adult population
Increased Prevalence of Hypertension in the United States from 1988-1994 (NHANES III) to 1999-2000 NHANES 30% increase, p<.001 Population With Hypertension (millions) Nearly 1 in 3 Adults (31%) in the US Has Hypertension Fields, et al. Hypertension. 2004;44:398f
Trends in Prevalence of Hypertension in the US Population, by Race/Ethnicity,1988-2000 * * ** ** ** *p<0.01, **p<0.001,compared to Non-Hispanic Whites within given time period; no significant trends across time periods within gender; analyses are age-adjusted to 2000 US population. Data from Hajjar I, Kotchen TA. Trends in prevalence, awareness, treatment, and control of hypertension in the United States, 1988-2000. JAMA 2003; 290: 199-206.
Hypertension Paradox: Changes in the Prevalence and Control of Hypertension in the United States (1988-2004) Rate of control: 27% to 35% Chobanian A. N Engl J Med 2009;361:878-887
White Black Red Yellow Green Brown Clear Table salt Soy sauce Catsup Mustard Pickles Soups & gravies Saline Colors of Salt
The connection between salt, obesity, hypertension and CVD mortality • During the past 25 years salt intake has increased by 1/3 to 150-170 mmol/day (3.5 to 4.0 g sodium/day). • This has contributed to the growing obesity epidemic and increased prevalence of hypertension by causing increased intake of high-calorie soft drinks containing corn sugar • Recent studies suggests that a decrease of 50 mmol/day below the current level (a reduction of 1/3) would decrease BP by 4.0/2.5 mm Hg in hypertensives and reduce CVD mortality in the US by more than 100,000/yr.
3. Why is hypertension considered a major Public health problem in the United States? Secondly, hypertension is associated with considerable cardiovascular risk.
High mortality, developing region Lower mortality, developing region Developed region Global Mortality 2000: Impact of Hypertension and Other Health Risk Factors High blood pressure Tobacco High cholesterol Underweight Unsafe sex High BMI Physical inactivity Alcohol Indoor smoke from solid fuels Iron deficiency 0 1000 2000 3000 4000 5000 6000 7000 8000 Attributable Mortality (In thousands; total 55,861,000) Ezzati et al. Lancet. 2002;360:1347-1360.
Is it a true risk factor or a risk marker? A true risk factor is suspected of being causative of the disease process. A risk marker is associated with the disease process without being in the causal pathway.
TIA, stroke LVH, CHD, HF Renal failure Retinopathy Peripheral vascular disease Complications of Hypertension: Hypertension is a risk factor TIA = transient ischemic attack; LVH = left ventricular hypertrophy; CHD = coronary heart disease; HF = heart failure.Cushman WC. J Clin Hypertens. 2003;5(Suppl):14-22.
: “Diabesity”
250 225 200 175 150 125 100 75 50 25 0 Association of Systolic BP andCV Death in Type 2 Diabetes Without diabetes With diabetes CV mortality rate/10,000 person-y <120 120–139 140–159 160–179 180–199 200 Systolic BP (mm Hg) Stamler et al. Diabetes Care. 1993;16:434.
Genetic susceptibility • Environmental factors • Nutrition • Obesity • Inactivity Progression of Diabetes Diagnosis of diabetes Appearance of complications Disability • Insulin resistance • HDL-C • Triglycerides • Atherosclerosis • Hypertension Death IGT Ongoing hyperglycemia Blindness ESRD/Dialysis/Transplantation CHD Stroke Amputation Hyperglycemia Retinopathy Nephropathy Neuropathy Brown. Diabetes Obes Metab. 2000;2:S11.
Proteinuria Is an Independent Risk Factor for Mortality in Type 2 Diabetes 1.0 Normoalbuminuria (n=191) 0.9 Microalbuminuria (n=86) 0.8 Survival (all-cause mortality) 0.7 Macroalbuminuria (n=51) 0.6 0.5 0 1 2 3 4 5 6 Years P<0.01, normo- vs micro- and macroalbuminuria. P<0.05, micro- vs macroalbuminuria. Gall et al. Diabetes. 1995;44:1303.
Diabetes Hypertension 50.1% 27% Diabetes:The Most Common Cause of ESRD Primary Diagnosis for Patients Who Start Dialysis Glomerulonephritis Other No. of patients 10% 13% 700 Projection 95% CI 600 500 400 No. of dialysis patients (thousands) 520,240 300 281,355 200 243,524 100 r2=99.8% 0 1984 1988 1992 1996 2004 2000 2008 United States Renal Data System. Annual data report. 2000.
ESRD in the USA • ↓ Mortality from MI & stroke over past 30 years • ↑ Life expectancy contributed to ↑ ESRD • Currently in USA > 300,000 patients on dialysis • The cost exceeds $ 50,000 per patient per year • Twenty one billion $ projected cost in 2002 • First year mortality ~ 20% • ~ 50% of deaths are cardiac (USRDS)
Life Expectancy for Selected U.S. Populations Expected remaining years USRDS 1993 Annual Data Report
3. Why is hypertension considered a major Public health problem in the United States? Thirdly, there is considerable reduction in cardiovascular risk with effective lowering of blood pressure with therapy.
Long-Term Antihypertensive Therapy Significantly Reduces CV Events Stroke Heart failure Myocardial infarction 0 –10 –20 Average reduction in events (%) 20%-25% –30 –40 35%-40% –50 >50% –60 Blood Pressure Lowering Treatment Trialists’ Collaboration. Lancet. 2000;355:1955-1964.
3. Why is hypertension considered a major Public health problem in the United States? Fourthly, there is insufficient awareness, treatment and control of hypertension.
Healthy People 2000/2010 Control Target = 50% Hypertension Awareness, Treatment, and Control: US 1976 to 2000* 73% 70% 68% Awareness 59% 55% 54% 51% 34% 31% % Adults 29% 27% Treated 10% Control NHANES II 1976-1980 NHANES III (Phase 2) 1991-1994 NHANES 1999-2000 NHANES III (Phase 1) 1988-1991 Chobanian et al. JAMA. 2003;289:2560-2572.
Risk Factor Clustering With Hypertension 30 Men 25 27% Women 26% 25% 24% 20 22% RiskFactors(%) 20% 19% 17% 15 10 12% 8% 5 0 0 1 2 3 ≥4 Number of Risk Factors Risk factor clustering with hypertension, ages 18–74 years. Framingham offspring. Kannel WB. Am J Hypertens. 2000.
Men: >102 cm (>40 in) • Women: >88 cm (>35 in) Abdominal obesity (waist circumference) • ≥150 mg/dL Triglycerides • Men: <40 mg/dL • Women: <50 mg/dL HDL-C • ≥130/≥85 mmHg (risk marker) Blood pressure • ≥100 mg/dL Fasting glucose BP is a risk marker for “The Metabolic Syndrome” NCEP-ATP III Definition: ≥3 of the Following* *Diagnosis is established when ≥3 of these risk factors are present.Expert Panel on Detection, Evaluation, and Treatment of High Blood Cholesterol in Adults. JAMA. 2001;285:2486-2497.
Other CVD Risk Factors: JNC 7 • Physical inactivity • Cigarette smoking • Age (older than 55 for men, 65 for women) • Family history of premature CVD (men under age 55 or women under age 65) *Components of the metabolic syndrome in blue Chobanian et al. JAMA. 2003;289:2560-2572
Framingham Heart Study (1983) CV Risk Profile 703 700 600 500 459 400 8 Year Probability Per 1,000 326 300 210 200 100 46 Systolic BP:Cholesterol:Glucose Intol.:Cigaretes: ECG-LVH: • >>> 185 • 185 • 0 • 0 • 0 • >>> 185 • 335 • 0 • 0 • 0 • >>> 185 • 335 • + • 0 • 0 • >>> 185 • 335 • + • + • 0 • >>> 185 • 335 • + • + • + Kannel, 1983
ATP-III: Framingham Point ScoresEstimate of 10-Year Risk for Men 1 3 5 Age Age Age Age Age 20-39 40-49 50-59 60-69 70-79 Age, y Points Systolic BP If If mm Hg Untreated Treated 20-34 -9 35-39 -4 40-44 0 45-49 3 50-54 6 55-59 8 60-64 10 65-69 11 70-74 12 75-79 13 <120 0 0 120-129 0 1 130-139 1 2 140-159 1 2160 2 3 Nonsmoker 0 0 0 0 0Smoker 8 5 3 1 1 6 Point Total 10-Year Risk, % <0 <1 0 1 1 1 2 1 3 1 4 1 5 2 6 2 7 3 8 4 9 5 10 6 11 8 12 10 13 12 14 1615 20 16 2517 30 4 HDL mg/dL Points 60 -1 50-59 0 40-49 1 <40 2 2 Total Age Age Age Age Age Cholesterol 20-39 40-49 50-59 60-69 70-79 <160 0 0 0 0 0 160-199 4 3 2 1 0 200-239 7 5 1 3 0 240-279 9 6 4 2 1280 11 8 5 3 1 Expert Panel on Detection, Evaluation, and Treatment of High Blood Cholesterol in Adults. JAMA. 2001;285:2486-2497.
Trials & meta-analyses: What we do not know (...and maybe will never know) • Trial duration is <10 years; treatment benefits should be considered in the very long term(decades). • Drop-in effect (subjects under placebo are given active drug) and drop-out effect (drop-outs in the active treatment group. • Subjects included in the trials are generally healthier than those treated in the clinical practice (selection of low-risk subjects). • Secondary end-points & subgroup analyses difficult to interperet.
“Hypertension may be an important compensatory mechanism which should not be tampered with, even were it certain that we could control it.” Paul Dudley White, 1931 Textbook of Cardiology.