BELL WORK
BELL WORK. Find your seat and put your stuff into the cubbie hole for your table Take out a pen or pencil Get your Solving for Acceleration, Speed, and Velocity paper from the front lab table. Relationships between Speed, Velocity, and Acceleration. Motion. It is a change in position

BELL WORK
E N D
Presentation Transcript
BELL WORK • Find your seat and put your stuff into the cubbie hole for your table • Take out a pen or pencil • Get your Solving for Acceleration, Speed, and Velocity paper from the front lab table
Motion • It is a change in position • Reference Point: the point from which all motion will be comparedto.
Distance • Distance: is measured as the length of a path between 2 points. Short distances are usually measured with meters and long with Kilometers. • Units: meters, kilometers, centimeters, miles, inches
Displacement • Displacement is how far an object travels from where it started. • It includes the direction: ( North(N), South(S), East(E), West(W)) • Units: meters, kilometers, centimeters, miles, inches
Distance VS. Displacement • Watch the Video • On your notesheet explain the difference
Speed • SPEED is the amount an object travels in a certain amount of time. • Units: m/s, km/s, m/hr, km/hr, mi/hr • There are 3 different kinds of speed • InstantaneousSpeed: the rate of motion at any given instant • ConstantSpeed: speed that doesn't vary • AverageSpeed: the total distance traveled by the total time of travel A speedometer registers instantaneous speed
Average Speed • Average speed is calculated over the entire trip that one takes. • Ratio of the total distance traveled to the total elapsed time • The equation can be written using quantity symbols
Velocity • Velocity: is the description of both speed and direction of motion. • A change in velocity can result from a change in speed or direction or a change in both speed and direction. • Units: m/s, km/s, m/hr, km/hr, mi/hr
Speed VS Velocity • Watch the Video • On your notesheet explain the difference
Acceleration • Means to speed up, slows down or change direction • Units: m/s2 , km/s2, m/min2 ,km/min2, m/hr2 , m/hr2 • Positive acceleration: acceleration that is in the same direction as velocity • Negative Acceleration: acceleration that is the opposite direction as velocity (AKA deceleration)
Velocity VS Acceleration • Acceleration and velocity are different quantities. • Going fast does not imply accelerating quickly. The two quantities are independent of one another. • Acceleration and Velocity have very different units • Remember the formula for Acceleration!
Relationships between Speed, Velocity, and Acceleration GRAPHING
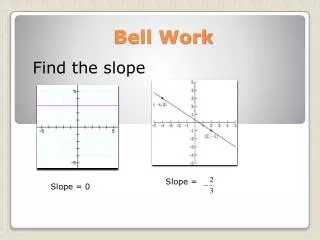
Reading Graphs • Graphs are a visual way to represent data. • The slope of a line is the rise (change along the y dimension) divided by the run (change along the x dimension) • The slope can tell you different information from each graph • The Greed letter delta, “” is often used in science to mean “a change in” • When interpreting graphs, you must always check to see if the y-axis represents distance, velocity, or acceleration • A horizontal line has very different meanings if the graph is a d-t graph, a v-t graph, or an a-t graph
Distance Time Graphs • Notice that time is on the x-axis and distance is on the y-axis. • By reading the coordinates on the graph, you can see that the automobile reached the 50 mi position at the end of 1 h; the 100 mi position at the end of 2 h; and the 150 mi position at the end of 3 h.
Distance- Time Graphs • When an object is moving at a steady velocity the line on the graph will move up or down in a straight line. • Notice that the slope of the graph indicates the speed of the person. • The faster an object travels the steeperthe line. • A slow speed has a gradual slope. • No motion has zero slope. • Constant acceleration has a curved slope • The graph of a person at rest is a horizontal line with a slope of zero—representing a speed of zero. • The slope of the tangent line (straight line that touches a curve in only one part) gives instantaneous speed
Acceleration on Distance-Time Graphs • Here’s how I used to remember if it was positive or negative acceleration on a d-t graph.
Distance-Time Graphs • Graph B: A person is traveling at a slow speed. As time increases, there is a small change in the position. • Graph C: A person is traveling at a fast speed. As time increases, there is a greater change in the position. • Graph D: A person is traveling in the opposite direction of the person in the previous graphs. As time passes, the change in position is in the opposite direction. • Graph E: A person is changing speed. As time passes, the change in position is increasing for each second. Notice that a changing speed is a curve on a distance-time graph. Graph A: A person is at rest. As time increases, there is no change in the position of the person. The person is standing still.
Velocity- Time Graphs • Notice that time is on the x-axis and velocity is on the y-axis. • On a velocity-time graph the slope equals acceleration. • The "y" intercept equals the initial velocity. • In these graphs, higher means faster not farther.
Velocity Time Graphs • On a velocity-timegraph • straight lines imply unchanging acceleration. • curved lines imply changing acceleration. • an object undergoing constant acceleration traces a straight line. • positiveslope implies an increase in velocity in the positive direction. • negative slope implies an increase in velocity in the negative direction. • zero slope implies motion with constant velocity. • the area under the curve equals the change in displacement. Acceleration
Acceleration- Time Graphs • Notice that time is on the x-axis and acceleration is on the y-axis. • On a acceleration-time graph the slope equals velocity.
Acceleration- Time Graphs • Slope is meaningless. • When acceleration is constant, the acceleration-time curve is a horizontal line. • A Line represents • the motion with increasing speedwhen it goes up • the motion with decreasing speed when it goes down Speeding Up Constant Acceleration Slowing Down