Download

1 / 27
280 likes | 392 Views
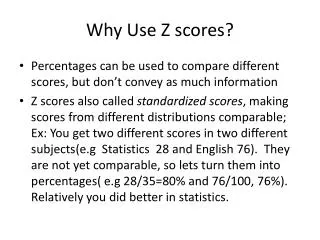
Learn about normal distribution, z-scores, histograms, and their relationship in statistics. Calculate percentile ranks and interpret standardized test scores.

E N D
Histogram • A bar chart of a frequency distribution. 0 — 2 1 — 3 2 — 0 3 — 2 4 — 4 5 — 3 6 — 3 7 — 5 8 — 3 9 — 2 10—2
Normal Distribution With some frequency distributions the histograms have lots of examples in the middle and fewer that are higher and lower.
Normal Distribution Measurements based on an underlying random phenomena distribute normally if you have enough data points.
12 10 8 6 4 2 0 1 2 3 4 5 6 7 8 9 10 11 12 13 14 15 16 17 18 19 20 21 22 23 24 25 26 27 28 Normal Distribution
4 2 0 1 2 3 4 5 6 7 8 9 10 11 12 13 14 15 16 17 18 19 20 21 22 23 24 25 26 27 28 Normal Distribution 12 10 8 6 A Normal Curve is the theoretical line that represents all of the responses in a normal distribution. The area under the curve encloses the frequency distribution of the normally distributed phenomena.
Characteristics of Normal Curves A line connecting the tops of the bars of a histogram.Mean, median and mode appear at the same point.Lots of responses in the middle fewer in the extremes.
One More Interesting Characteristic of Normal Curves 1 Standard Deviation Mean
One More Interesting Characteristic of Normal Curves 1 Standard Deviation Mean 50.0
One More Interesting Characteristic of Normal Curves 1 Standard Deviation Mean 50.0 34.13
One More Interesting Characteristic of Normal Curves 2 Standard Deviations Mean 50.0 34.13 13.59
A test score Cognitive abilities are normally distributed.
A test score Then, if the tests are designed carefully the assessment of cognitive ability should be normally distributed as well.
A test score Results from a standardized test are, by definition, normal distributed.
A test score z Scores Mean SD -3 -2 -1 1 2 3 If you know the percentage of scores that are lower than the target score you will know the Percentile Rank of the target score.
Normal Curves 2 Standard Deviations Mean 50.0 34.13 13.59 1. The relationship between SD and percentage of the area under the curve is constant regardless of the distribution. 2. If the mean and SD of the distribution are known then the percentage of scores lower than every possible score can be computed. 3. In other words, percentile rank of every score can be computed.
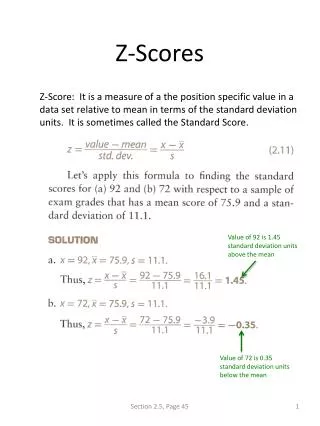
z Score Computation • Subtract the mean of the distribution from the target score. • Divide by the standard deviation. • Look up the z score on the z table.
Target Score(28) Subtract the mean of the distribution from the target score. Divide by the standard deviation. Look up the z score on the z table. Mean(25.69) 1 SD(2.72) SD -3 -2 -1 1 2 3 Number of SD away from the mean Percentage of scores lower than the target score
z Score • Target score (28) • Score - Mean (28 - 25.69 = 2.31) • Result / SD (2.31 / 2.72 = .85) • Look up on z table (0.85) • z = 0.85; area = .80 • Score is in the 80th percentile
28 z Scores 25.69 SD -3 -2 -1 1 2 3 .85 SD 80 % of scores
Target Score z Scores Mean SD -3 -2 -1 1 2 3
z Scores 23 25.69 SD -3 -2 -1 1 2 3 -.99 SD 16 % of scores
z Score • Target score (23) • Score - Mean (23 - 25.69 = -2.69) • Result / SD (-2.69 / 2.72 = -.99) • Look up on z table (-.99) • Z = -0.99; area = .16 • Score is in the 16th percentile
z Scores 23 25.69 SD -3 -2 -1 1 2 3 -.99 SD 16 % of scores
Percentile Rankings • z Scores • Assume a normal distribution • Based on knowing everyone in the population • Allows comparison of individualto the whole
What is Molly’s percentile ranking on the test? What is Karl’s • 34 • 56 • 22 • 31 • 44 • 47 • 37 • 42 • 51 • 37 • 40 • 29 • 36 • 39 • 52 • 39 • 29 • 51 • 45 • 47 • 42 Karl Molly
Bobby and Sally take a standardized test that has 160 questions • Bobby gets a raw score of 140 and has a percentile rank of 52. Sally gets a raw score of 142 and has a percentile rank of 67. • This doesn’t make sense to Bobby’s mother. First, how can 140 out of 160 be 52nd percentile. And second, why should just a couple of points on the test make such a huge percentile rank difference? What are you going to tell her?