Download

1 / 18
180 likes | 398 Views
Z scores. MM3D3. Recall: Empirical Rule. 68% of the data is within one standard deviation of the mean 95% of the data is within two standard deviations of the mean 99.7% of the data is within three standard deviations of the mean. 99.7%. 95%. 68%. Example.

E N D
Z scores MM3D3
Recall: Empirical Rule • 68% of the data is within one standard deviation of the mean • 95% of the data is within two standard deviations of the mean • 99.7% of the data is within three standard deviations of the mean 99.7% 95% 68%
Example • IQ Scores are Normally Distributed with N(110, 25) • Complete the axis for the curve 99.7% 95% 68% 35 60 85 160 135 185 110
Example • What percent of the population scores lower than 85? 16% 99.7% 95% 68% 35 60 85 160 135 185 110
Example • What percent of the population scores lower than 100? 99.7% 95% 68% 35 60 85 100 160 135 185 110
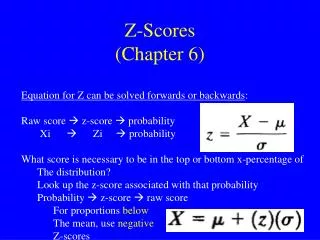
Z Scores • Allow you to get percentages that don’t fall on the boundaries for the empirical rule • Convert observations (x’s) into standardized scores (z’s) using the formula:
Practice:Convert the following IQ Score N(110, 25) to z scores: • 100 • 125 • 75 • 140 • 45 • -.4 • .6 • -1.4 • 1.2 • -2.6
Z Scores • The z score tells you how many standard deviations the x value is from the mean • The axis for the Standard Normal Curve: -3 1 0 3 -2 2 -1
Z Score Table: • The table will tell you the proportion of the population that falls BELOW a given z-score. • The left column gives the ones and tenths place • The top row gives the hundredths place • What percent of the population is below .56? • .7123 or 71.23%
Z Score Table: • The table will tell you the proportion of the population that falls BELOW a given z-score. • The left column gives the ones and tenths place • The top row gives the hundredths place • What percent of the population is below .4? • .6554 or 65.54%
Practice:Use your z score table to find the percent of the population that fall below the following z scores: • z < 2.01 • z < 3.39 • z < 0.08 • z < -1.53 • z < -3.47 • 97.78% • 99.97% • 53.19% • 6.30% • .03%
Using the z score table • You can also find the proportion that is above a z score • Subtract the table value from 1 or 100% Find the percent of the population that is above a z score of 2.59 • z > 2.59 • 1-.9952 • .0048 or .48% Find the percent of the population that is above a z score of -1.91 • z > -1.91 • 1-.0281 • .9719 or 97.19%
Using the z score table • You can also find the proportion that is between two z scores • Subtract the table values from each other Find the percent of the population that is between .27 and 1.34 • .27 < z < 1.34 • .9099-.6064 • .3035 or 30.35% Find the percent of the population that is between -2.01 and 1.89 • -2.01 < z < 1.89 • .9706-.0222 • .9484 or 94.84%
Application 1 • IQ Scores are Normally Distributed with N(110, 25) • What percent of the population scores below 100? • Convert the x value to a z score • z < -.4 • Use the z score table • .3446 or 34.46%
Application 2 • IQ Scores are Normally Distributed with N(110, 25) • What percent of the population scores above 115? • Convert the x value to a z score • z > .2 • Use the z score table • .5793 fall below • 1-.5793 • .4207 or 42.07%
Application 3 • IQ Scores are Normally Distributed with N(110, 25) • What percent of the population score between 50 and 150? • Convert the x values to z scores • -2.4 < z < 1.6 • Use the z score table • .9452 and .0082 • This question is asking for between, so you have to subtract from each other. • .9452-.0082 • .9370 or 93.7%