Download
1 / 31
310 likes | 424 Views
This article highlights the importance of economic costs in conservation planning, focusing on assessing and improving conservation plans by incorporating various types of costs. It emphasizes the impact of including spatial distribution of costs in planning for more efficient and cost-effective outcomes.

E N D
The relevance of economic costs to conservation planning Robin Naidoo WWF-US robin.naidoo@wwfus.org
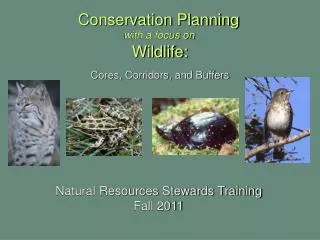
Conservation planning • Systematic cons. planning is about maximizing cost-effectiveness • Very sophisticated on biological side • Relatively crude on costs side • But, great gains result from consideration of costs *costs are heterogeneous *plans more efficient when this accounted for
Outline • What are conservation costs? • How are conservation costs assessed? • How are conservation plans improved by including costs?
I. What are conservation costs? • Acquisition costs • Management costs • Transaction costs • Damage costs • Opportunity costs
Focus on monetary costs $ $ $
WEIGHTED NON-MONETARY COST PROXY Tres Positive Positive Neutral Negative Tres Negative I. What are conservation costs? • Non-monetary proxies: Add map of non-monetary proxies =
How are costs used? • Cost-effective analysis: • Costs in $ terms, benefits in original units; maximize benefits per $ of cost • Cost-benefit analysis: • Map all $ costs and $ benefits of conservation, compare
II. Assessing conservation costs • Examples of spatial distribution of acquisition costs, management costs, opportunity costs • No examples of transaction costs or damage costs
Acquisition costs • United States: county-level data on agricultural land values
Acquisition costs • Denmark: county-level data on agricultural land values Strange et al. Biol. Conserv. 2007
Acquisition costs • South Africa: modelled farm-level sale prices Osano et al. Unpublished data
Acquisition costs • Bahia, Brazil: modelled farm-level sale prices Chomitz et al. Env. Dev. Econ. (2005)
Management costs • Global surveys of protected area managers (terrestrial & marine) • Modelled cost of Pa management based on GNP, PPP, and PA area • Balmford and colleagues, • Proc. Nat. Acad. Sci. 2003,2005
Management costs • Used in a variety of conservation planning applications, eg. Africa-wide Moore et al. Biol. Cons. (2004)
Opportunity costs • Global: Opp. costs based on returns to agriculture (crops and livestock) Naidoo & Iwamura Biol. Cons. (in press)
Opportunity costs • Mbaracayu, Paraguay: for forests, based on agricultural net rents integrated with conversion probabilities Naidoo & Adamowicz Cons. Biol.(2006)
Opportunity costs • Marine examples: • Foregone sales value of fish and shellfish off Welsh coast (Richardson et al. Cons. Biol. 2006) • Foregone revenue from harvest of rock lobster in South Australia (Stewart and Possingham Env. Model. Ass. 2005)
III. Including costs in planning • General result that including spatial distribution of costs up-front in conservation planning can greatly increase efficiency of resulting plans
III. Including costs in planning • General result that including spatial distribution of costs up-front in conservation planning can greatly increase efficiency of resulting plans
Costs in planning • Global: Plans that consider costs represent endemic species at 10 to 33 % of the opportunity cost of plans that do not (ecoregion-level) Naidoo & Iwamura Biol.Cons.(in press)
Costs in planning • Continental: Plans that consider costs represent 2/3rds more vertebrate species for the same opportunity cost compared to plans that do not (ecoregion-level) in Africa Moore et al. Biol.Cons.(2004)
Costs in planning • Sub-national: Plans that consider costs represent the same # of vertebrate species at roughly 10% of the opportunity costs of plans that do not in Oregon, USA Polasky et al. Land Econ.(2001)
Costs in planning • Landscape: Plans that consider costs have provide environmental benefits for 16-67% of total cost compared to plans that focus only on benefits (New York state, USA) Ferraro J. Pol. Analy. Man.(2003)
= remaining forests Naidoo & Ricketts PLoS 2006 $11,384,552 Value (U.S. $) cost benefit
Naidoo & Ricketts PLoS 2006 $11,384,552 Value (U.S. $) $4,670,904 cost benefit = wild meat > land value + timber
Naidoo & Ricketts PLoS 2006 $11,384,552 $8,806,601 Value (U.S. $) cost benefit = wild meat + timber > land value + pharm.
$13,506,473 Naidoo & Ricketts PLoS 2006 $11,384,552 Value (U.S. $) cost benefit = wild meat + timber > land value + pharm. + existence
$207,143,557 Naidoo & Ricketts PLoS 2006 Value (U.S. $) $11,384,552 cost benefit = wild meat + timber + pharm. > land value + existence + carbon (5$/T)
IV. Conclusions • Just as biodiversity is unevenly distributed in space, so are costs • Plans that consider spatial distr. of costs at the outset deliver more biodiversity for less cost
Questions? Email: robin.naidoo@wwfus.org