Download
1 / 21
210 likes | 588 Views
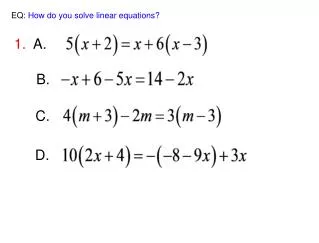
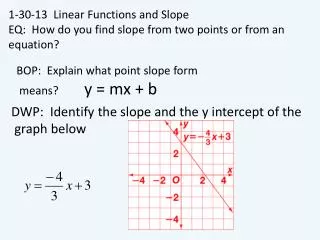
1-30-13 Linear Functions and Slope EQ: How do you find slope from two points or from an equation? . BOP: Explain what point slope form means? y = mx + b. DWP: Identify the slope and the y intercept of the graph below. http://www.youtube.com/watch?v=FmIhlc1bJuA. SLOPE .

E N D
1-30-13 Linear Functions and Slope EQ: How do you find slope from two points or from an equation? BOP: Explain what point slope form means?y = mx + b DWP: Identify the slope and the y intercept of the graph below
http://www.youtube.com/watch?v=FmIhlc1bJuA SLOPE http://www.youtube.com/watch?v=mK-BZs1uVZM Y = mx + b
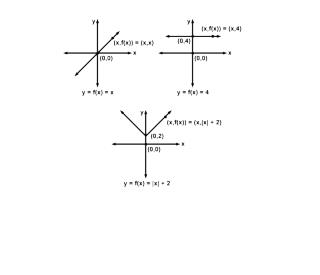
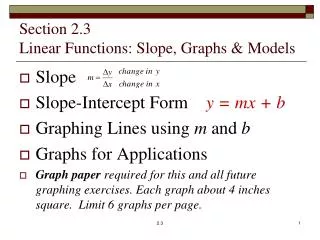
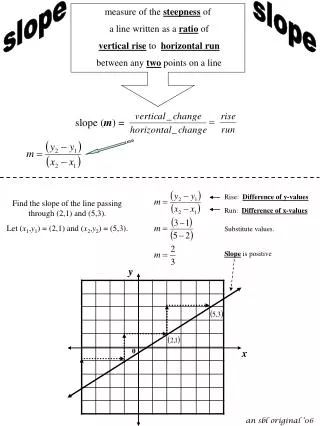
Toolbox: Read “Change in y over change in x.”
Focus Lesson Day 128 • Make a table of values that satisfy the given equation. • Plot the points from your table to help you graph the equation. • Find the slope of your graph. • Find the y-intercept of your graph. (The y-intercept of a line is the point where it crosses the y-axis.)
Make a table of values for each equation. Then use the points from your table to help you graph the equation. Find the slope and y-intercept for each graph. • y = -3x – 2 m = -3; y-intercept = -2 2. y = 2x m = 2; y-intercept = 0 3. y = x m = 1; y-intercept = 0 4. y = 6 m = 0; y-intercept = 6 5. y = 1 – x m = -1; y-intercept = 1 6. How are the slope and y-intercept of the graph related to the equation?
For each of the previous equations, the slope (m) is the coefficient of x and y-intercept (b) is the constant in the equation. Slope-intercept form: y= mx + b. How would you graph the equation y = -½x + 3 without making a table? Steps: A. Determine the slope & y-intercept of the equation. B. Plot the point for the y-intercept. C. From the y-intercept, use slope to plot another point on the graph. D. Use slope to find a 3rd point and then connect the points with a straight line.
Graph each of the following equations without creating a table.
Consider the set of equations shown below: • y = 5x B. y = ⅓x – 2 C. y = -x • y = 3x + 4 E. y = 0.5x + 1 F. y = -2x – 4½ • Which equation has the flattest graph? How do you know? • Which equations have graphs that slant downward as you go from left to right? How do you know? • Which equation has a graph that crosses the y-axis at the highest point? Why? • Write an equation of your own whose graph would be steeper than the graph of any of the six given equations. • Write an equation of your own whose graph would be flatter than those of the six given equations. • Write an equation of your own whose graph crosses the y-axis at a lower point than any of the 6 given equations.
Sample EOG Question: Which equation describes the line graphed below?
Summary: Don’t forget to write your minimum three sentence summary answering today’s essential question here! HW: Graphing Linear Functions