Download
1 / 54
540 likes | 617 Views
Explore the effects of open Arctic records on ice concentration, drilling activities in Chukchi Sea and Kara Sea, storm patterns, and wave heights in the Chukchi Sea and Kara Sea regions. Discover the correlation between Arctic conditions and global climate changes.

E N D
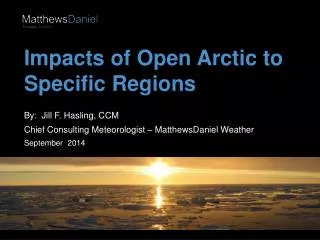
Impacts of Open Arctic to Specific Regions By: Jill F. Hasling, CCM Chief Consulting Meteorologist – MatthewsDaniel Weather September 2014
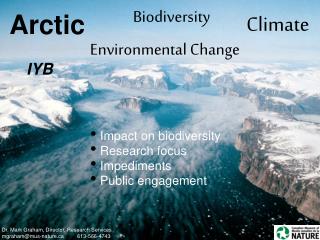
Open Arctic records • Since 2007, Summer Open Arctic records are set at 3 year intervals. • Multi-year ice lasts through the summer. • Ice is concentrated on the Canadian side of the Arctic Ocean and has disappeared from the Eurasian Arctic waters and coasts.
DIFFERENCE OF ICE CONCENTRATION IN March 2012 and august 2012
drilling • What does that mean for drilling in the Chukchi Sea and Kara Sea?
CHUKCHI SEA DATE WHEN CHUKCHI SEA BECOMES NON-ICE COVERED 2007 - 2013
July 16, 2013 Chukchi Sea
August 7, 2012 Chukchi Sea
July 8, 2011 Chukchi Sea
July 19, 2010 Chukchi Sea
July 13, 2009 Chukchi Sea
August 31, 2008 Chukchi Sea
July 18, 2007 Chukchi Sea
CHUKCHI SEA DATE WHEN CHUKCHI SEA MARGINAL ICE ZONE RETURNS 2007 - 2013
November 6, 2013 Chukchi Sea
November 3, 2012 Chukchi Sea
November 14, 2011 Chukchi Sea
October 28, 2010 Chukchi Sea
November 5, 2009 Chukchi Sea
November 10, 2008 Chukchi Sea
October 28, 2007 Chukchi Sea
KARA SEA DATE WHEN KARA SEA BECOMES NON- ICE COVERED 2007 - 2013
July 28, 2013 Kara Sea
July 3, 2012 Kara Sea
July 2, 2011 Kara Sea
August 22, 2010 Kara Sea
August 7, 2009 Kara Sea
August 18, 2008 Kara Sea
September 1, 2007 Kara Sea
KARA SEA DATE WHEN KARA SEA MARGINAL ICE ZONE RETURNS 2007 - 2013
October 22, 2013 Kara Sea
November 27, 2012 Kara Sea
November 9, 2011 Kara Sea
October 29, 2010 Kara Sea
November 1, 2009 Kara Sea
October 13, 2008 Kara Sea
October 25, 2007 Kara Sea
OPEN ARCTIC MEANS MORE STORMS ALONG THE ARCTIC CIRCLE
Open Arctic • From 2000 to 2010, about 1,900 cyclones churned across the top of the world each year, leaving warm water and air in their wakes—and melting sea ice in the Arctic Ocean. • When you narrow the search down to cyclones that occurred directly over the Arctic Ocean, you find more than 200 to 300 storms per year
2000 - 2006 1950 - 1972 Greenland Greenland Canada Russia Canada Russia Data from Arctic buoys reporting surface air temperatures and sea level pressure were used to create sparse storm tracks from 1950 to 1972. Buoys also captured the data used to create the more abundant storm tracks from 2000 to 2006. Credit: NASA.
More storms mean… • More storms mean more snow. This means a colder atmosphere as sun’s radiation is reflected back into the space.
Observed waves • Reviewing the Observed Waves in the Chukchi Sea and the Kara Sea, you see that when the ice retreats the wind fetch increases. If you assume that the near zero wave heights indicate ice, you can see on the following charts that the drilling season could be longer depending on your drilling location.
1979-1988 1990-1999 2000-2012 • Significant Wave heights in the Chukchi sea (July - Nov.)
1979-1988 1990-1999 2000-2012 • Significant Wave heights in the Kara sea (July - Nov.)