Glycolysis
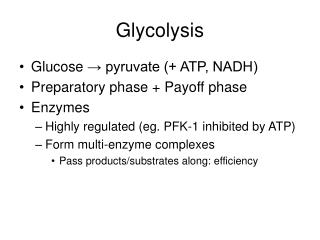
Glycolysis. Anaerobic degradation of glucose to yield lactate or ethanol and CO 2. Learning Objectives. Sequence of Reactions Metabolites Enzymes Enzyme Mechanisms Energetics Regulation. Overview of Glycolysis. Glucose (C 6 ) —> 2 Pyruvate (C 3 ) 2 ADP + 2 P i —> 2 ATP. Glycolysis.

Glycolysis
E N D
Presentation Transcript
Glycolysis Anaerobic degradation of glucose to yield lactate or ethanol and CO2
Learning Objectives • Sequence of Reactions • Metabolites • Enzymes • Enzyme Mechanisms • Energetics • Regulation
Overview of Glycolysis Glucose (C6) —> 2 Pyruvate (C3) 2 ADP + 2 Pi —> 2 ATP
Glycolysis Figure 15-1
Summary of Stage I Glucose + 2 ATP ——> 2 GA3P + 2 ADP + 2 H+
Stage II of Glycolysis(Energy Recovery) Substrate Level Phosphorylation —> Serine, Cysteine and Glycine —> Aromatic Amino Acids —> Alanine Substrate Level Phosphorylation
Summary of Stage II 2 GA3P + 2 NAD+ + 4 ADP + 2 Pi 2 Pyruvate + 2 NADH + 2 H+ + 4 ATP
Summary of Glycolysis Glucose + 2 NAD+ + 2 ADP + 2 Pi 2 Pyruvate + 2 NADH + 2 H+ + 2 ATP NOTE: NAD+ must be regenerated!
Hexokinase(First Use of ATP) Go’ (kJ/mol) G (kJ/mol) Glucose + Pi G-6-P + H2O 13.8 20.5 ATP + H2O ADP + Pi -30.5 -54.4 Glucose + ATP G-6-P + ADP -16.7 -33.9 NOTE: Lack of Specificity
Role of Mg2+ Page 489
Substrate-induced Conformational Changes in Yeast Hexokinase Figure 15-2
Results of Conformational Change • Formation of ATP binding site • Exclusion of water • Increased nucleophilicity of CH2OH • Proximity effect
Regulation of Hexokinase Inhibition by glucose-6-P Impermeability
Hexokinase versus Glucokinase • Hexokinase (all tissues) • Non-specific • KM = ~100 µM • Inhibited by glucose-6-P • Glucokinase (primarily in liver) • Specific • KM = ~10 mM • Not inhibited by glucose-6-P
Functional Rationale • Most tissues: metabolize blood glucose which enters cells • Glc-6-P impermeable to cell membrane • Product inhibition • Liver: maintain blood glucose • High blood glucose: glycogen • Low blood glucose: glycolysis
Hexokinase versus Glucokinase Figure 22-4
Metabolism of Glucose-6-P Regulation!
Phosphoglucose Isomerase Go’ (kJ/mol) G (kJ/mol) Glucose-6-phosphate Fructose-6-phosphate 2.2 -1.4
Reaction Mechanism of Phosphoglucose Isomerase(Substrate Binding) Figure 15-3 part 1
Reaction Mechanism of Phosphoglucose Isomerase(Acid-Catalyzed Ring Opening) Figure 15-3 part 2
Reaction Mechanism of Phosphoglucose Isomerase(Formation of cis-enediolate Intermediate) Figure 15-3 part 3
Reaction Mechanism of Phosphoglucose Isomerase(Proton Transfer) Figure 15-3 part 4
Reaction Mechanism of Phosphoglucose Isomerase(Base-Catalyzed Ring Closure) Figure 15-3 part 5
Reaction Mechanism of Phosphoglucose Isomerase(Product Release) Figure 15-3 part 1
Phosphofructokinase(Second Use of ATP) Go’ (kJ/mol) G (kJ/mol) F-6-P + Pi F-1,6-bisP + H2O 16.3 36.0 ATP + H2O ADP + Pi -30.5 -54.4 F-6-P + ATP F-1,6-bisP + ADP -14.2 -18.8 NOTE: bisphosphate versus diphosphate
Characteristics of Reaction Catalyzed by PFK • Rate-determining reaction • Reversed by Fructose-1,6-bisphosphatase • Mechanism similar to Hexokinase
Regulatory Properties of PFK • Main control point in glycolysis • Allosteric enzyme • Positive effectors • AMP • Fructose-2,6-bisphosphate • Negative effectors • ATP • Citrate
-D-Fructose-2,6-Bisphosphate Page 558
Formation and Degradation of -D-Fructose-2,6-bisP High glucose Low glucose
Carbon # from glucose Aldolase 1 2 3 4 5 6 Go’ (kJ/mol) G (kJ/mol) F-1,6-bisP GAP + DHAP 23.8 ~0
Mechanism of Base-Catalyzed Aldol Cleavage NOTE: requirement for C=O at C2 Rationale for Phosphoglucose Isomerase Figure 15-4
Enzymatic Mechanism of Aldolase(Substrate Binding) Figure 15-5 part 1
Enzymatic Mechanism of Aldolase(Schiff Base (imine) Formation) Figure 15-5 part 2
Enzymatic Mechanism of Aldolase(Aldol Cleavage) Figure 15-5 part 3
Enzymatic Mechanism of Aldolase(Tautomerization and Protonation) Figure 15-5 part 4
Enzymatic Mechanism of Aldolase(Schiff Base Hydrolysis and Product Release) Figure 15-5 part 5
Triose Phosphate Isomerase Go’ (kJ/mol) G (kJ/mol) DHAP GAP 7.5 ~0
Transition State Analog Inhibitors ofTriose Phosphate Isomerase Part 494
Schematic Diagram of the First Stage of Glycolysis Figure 15-7
Summary of Stage I Glucose + 2 ATP ——> 2 GA3P + 2 ADP + 2 H+
Glyceraldehyde-3-P DehydrogenaseGAPDH 3,4 2,5 1,6 Go’ (kJ/mol) G (kJ/mol) GAP + NAD+ H2O 3-PG + NADH + H+ -43.1 36.0 3PG + Pi 1,3-BPG + H2O 49.4 -54.4 GAP + NAD+ + Pi 1,3-BPG + NADH + H+ 6.3 -18.8
Enzymatic Mechanism ofGlyceraldehyde-3-P Dehydrogenase(Substrate Binding) Figure 15-9 part 1