Download
1 / 5
50 likes | 171 Views
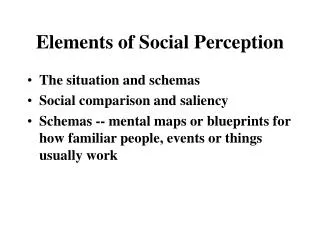
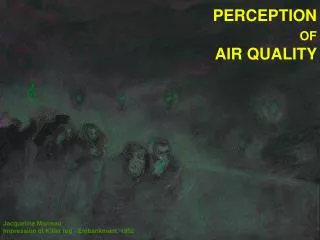
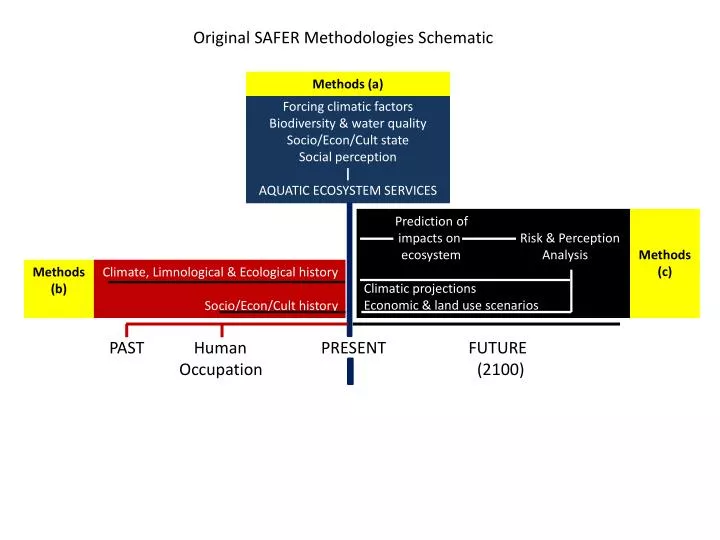
Original SAFER Methodologies Schematic. Methods (a). Forcing climatic factors Biodiversity & water quality Socio/Econ/Cult state Social perception | AQUATIC ECOSYSTEM SERVICES. Prediction of impacts on Risk & Perception

E N D
Original SAFER Methodologies Schematic Methods (a) Forcing climatic factors Biodiversity & water quality Socio/Econ/Cult state Social perception | AQUATIC ECOSYSTEM SERVICES Prediction of impacts on Risk & Perception ecosystem Analysis Climatic projections Economic & land use scenarios Methods (c) Methods (b) Climate, Limnological & Ecological history Socio/Econ/Cult history PAST Human PRESENT FUTURE Occupation (2100)
Tier 1 Modeling (in general) • “Tier 1” models (vocabulary from the Natural Capital Group) are vastly simplified, first-approximation models (usually simple indices) characterizing water, ecosystem or socioeconomic states throughout an area (each would be mapped). • Example 1 (climate): A tier 1 climatic model would be the annual water yield for a land area, which is a function of precipitation and evapotranspiration • Example 2 (biodiversity): A tier 1 biodiversity model would be some combination of habitat quality and habitat rarity indices. • Example 3 (socioeconomic: A tier 1 tourism services model would be a map summarizing tourism opportunities along with accessibility and environmental attributes (i.e., some form of “potential tourism” index) • Note: First, we may want to map simpler socioeconomic indices related to population, income, education, etc.—yes(??) • Limitations: (1) Causes and effects are not connected; (2) Analysis typically only possible at the annual time scale, so shorter-term (e.g., seasonal) processes are averaged. • Tier 1 modeling should be do-able as team science in the short term. For example, small student teams could easily GIS analyses for multiple sites.
Tier 2 Modeling (in general) • “Tier 2” models (vocabulary from the Natural Capital Group) are more details and capable of simulating distributed processes and mechanisms in physical, ecological and socioeconomic systems. • Example 1 (climate): A tier 2 climatic model would be a distributed parameter hydrologic model (e.g., SWAT, WEAP, VIC) • Example 2 (biodiversity): A tier 2 biodiversity model might involve might include a keystone species population model, or a model capable of addressing the food web and multiple populations • Example 3 (socioeconomic): A tier 2 tourism services might predict annual visitor-days or dollars based on environmental attributes, infrastructure, amenities, distance from population centers, and location relative to potential substitute sites. • Limitations: Tier 2 models require substantially more input parameters than do Tier 1 models, and take longer to learn how to use effectively • Tier 2 modeling will typically require prolonged efforts by graduate students, perhaps as key components of their dissertation work, and may be integrated later with comparable modeling studies by other students.
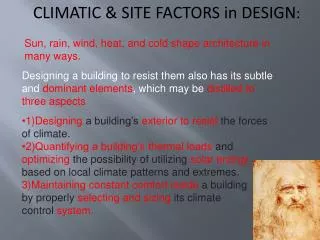
Methods (a)—SAFER • Forcing climatic factors: • Map climate surfaces (temp, precip) • From climate surfaces and soil surveys, map water yield, Budyko dryness, and water retention indices • Socio/Econ/Cult State • Map various socioeconomic indices (population density, land ownership, land use, etc.) • Cultural/spiritual indices? Maybe deal with in terms of peoples’ perceptions? • Biodiversity and water quality: • Map habitat quality (related to water quality), habitat rarity indices—is this feasible for all our sites? • Identify correlations between various indices
Methods (c)—SAFER • For 2030, 2050, 2100 • Generate forecasts of climate surfaces • Using regional modeling products (if they exist) • If not, how? Downscale available GCM outputs? • Use forecasts to generate new hydro/climate indices • Propose population and LULC scenarios • Generate habitat/ecosystem quality and rarity maps • Quantify risk in terms of ecosystem-related indices changes in habitat quality and rarity maps