Download
1 / 60
600 likes | 614 Views
Explore a century of tropical storm and hurricane tracks shaping disaster resilience. Learn key lessons, risk assessment, and policy options. Discover typical impacts and historical hurricane case studies to enhance understanding and preparedness. Uncover the importance of adopting resilient policies to mitigate hurricane risks globally.

E N D
LEARNING FROM GLOBAL DISASTER LABORATORIESPART 3: HURRICANES Walter Hays, Global Alliance for Disaster Reduction, Vienna, Virginia, USA
TRACKS OF MORE THAN 1325 HURRICANE DISASTER LABORATORIES FOR LEARNING • EACH HURRICANE TEACHES IMPORTANT TECHNICAL AND POLITICAL LESSONS ABOUT HURRICANE DISASTER RESILIENCE.
Storm Hazards: • Wind pressure • Surge • Rain • Flood • Waves • Salt water • Missiles • Tornadoes • SEVERE WINDSTORMS • INVENTORY • VULNERABILITY • LOCATION • PREPAREDNESS • PROTECTION • EARLY WARNING • EMERGENCY RESPONSE • RECOVERY and • RECONSTRUCTION RISK ASSESSMENT POLICY OPTIONS ACCEPTABLE RISK RISK UNACCEPTABLE RISK HURRICANE DISASTERR RESILIENCE Wind profile DATA BASES AND INFORMATION Gradient Wind Ocean COMMUNITY
NATIONS THAT NEED TO BECOME HURRICANE DISASTER RESILIENT • CANADA • USA • MEXICO • CENTRAL AMERICA NATIONS • JAIMAICA AND WEST INDIES • CARIBBEAN BASIN NATIONS
WE CONTINUE TO OPERATE WITH A FLAWED PREMISE: KNOWLEDGE FROM HURRICANE DISASTERS, WHICH OCCUR ANNUALLY IN THE ATLANTIC AND EASTERN PACIFIC BASINS, IS ENOUGH TO MAKE ANY NATION SUSCEPTIBLE TO HURRICANES ADOPT AND IMPLEMENT POLICIES THAT WILL FACILITATE ITS DISASTER RESILIENCE
FACT: IT USUALLY TAKES MULTIPLE HURRICANE DISASTERS BEFORE A STRICKEN NATION WILL ADOPT AND IMPLEMENT POLICIES THAT MOVE IT TOWARDS HURRICANE DISASTER RESILIENCE
FACT: MOST UNAFFECTED NATIONS DON’T EVEN TRY TO LEARN ANYTHING NEW FROM ANOTHER NATION’S HURRICANE DISASTERS AND CERTAINLY DON’T CONSIDER THEM TO BE A BASIS FOR CHANGING EXISTING POLICIES
CAUSES OF RISK WIND AND WATER PENETRATE BUILDING ENVELOPE UPLIFT OF ROOF SYSTEM FLYING DEBRIS PENETRATES WINDOWS STORM SURGE HURRICANES HEAVY PRECIPITATION IN A SHORT TIME GLOBAL DISASTER LABORATORIES FLASH FLOODING (MUDFLOWS) LANDSLIDES (MUDFLOWS)
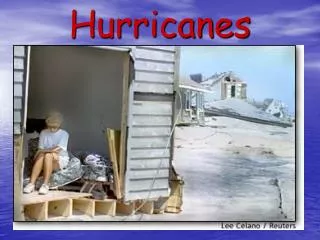
TYPICAL SOCIOECONOMIC IMPACTS • A community’s (worst case--the Capital) functions are shut down for a time • Downed trees • Flooded streets • Power outages • Roofs ripped off
TYPICAL SOCIOECONOMIC IMPACTS • Major roads blocked by debris • Bridges washed out or impassible • Sea wall, levees, etc., damaged • Airport closed; planes damaged on the runway • Landslides
TYPICAL SOCIOECONOMIC IMPACTS • Region- and locale-specific damage to food crops and “money crops” (i.e., exportable goods)
EXAMPLES OF PAST HURRICANE DISASTER LABORATORIES THAT TAUGHT MANY LESSONS
SOME OF THE “BAD” HURRICANES: 1989-2013 • Hugo Sept 1989 • Andrew Aug 1992 • Opal Oct 1995 • Floyd Sept 1999
ANDREW: One of the most intense and the last of the three Category 5 hurricanes to make US landfall in the 20th century, Andrew had sustained winds of 165 mi/hr and caused catastrophic damage in Florida.
SOME OF THE “BAD” HURRICANES: 1989-2013 (Continued) • Mitch Nov 1998 • Charley Aug 2004 • Ivan Sept 2004 • Dennis 2005 • Katrina Aug 2005
KATRINA: Nearly every levee in the Federal Protection System of New Orleans’ was breached, eventually causing 80 percent of the city to be flooded, and 1,836 people to lose their lives. .
“BAD” HURRICANES: 1989-2013 (Continued) • Rita Sept 2005 • Stan Sept 2005 • Wilma Oct 2005 • NONE 2006
RITA: In addition to a record evacuation of over 1 million people that took evacuees to places like the First Baptist Church in Tyler, TX, Rita’s winds, waves, and storm surge caused damage to the oil industry and flooding in New Orleans again.
WILMA: A CAT 5 storm, Wilma was the most intense hurricane ever recorded in the Atlantic basin, but it was a Category 3 when it made landfall in several places, causing devastation in the Yucatan Peninsula, Cuba, and Florida.
SOME OF THE “BAD” HURRICANES: 1988-2013 (Continued) • Dean 2007 • Felix 2007 • Noel, 2007
HURRICANE DEAN: A CATEGORY 2-3 STORM ON AUGUST 17 • The eye of hurricane Dean, the first of the North Atlantic season, passed between the Caribbean islands: St. Lucia and Martinique, on Friday,August 17. • The two islands, less than 80 km (50 mi) apart were, were struck with winds of 165 - 200 km per hour (100 - 125 mi per hour), storm surge, and heavy rain.
SOME OF THE “BAD” HURRICANES: 1988-2013 (Continued) • Gustav Sept 2008 • Ike 2008 • Paloma 2008 • NONE 2009
GUSTAV: Gustav prompted the largest evacuation in USA history-- 3 million people-- who fled the oncoming hurricane, after it had made landfall in Haiti and Cuba, crossed the Gulf of Mexico, and made landfall again in Cocodrie, La., on Sept. 1, 2008.
SOME OF THE “BAD” HURRICANES: 1989-2013 (Continued) • Igor 2010 • Tomas 2010 • Irene 2011 • None 2012 • Sandy 2013
SANDY: A $300 BILLION STORM; OCTOBER 24, 2012 Sandy, 2012’s ninth hurricane, became a huge storm with wind and rain bands reaching out 500 km or more from the storm center, producing 15-50 cm of rain and flooding in Jamaica, Bermuda, Haiti, Dominican Republic, Cuba, New Jersey, and New York
LESSON: THE TIMING OF ANTICIPATORY ACTIONS IS VITAL • The people who know: 1) what to expect (e.g., storm surge, high-velocity winds, rain, flash floods, and landslides,),2) where and when it will happen, and 3) what they should (and should not) do to prepare will survive.
LESSON: TIMELY EARLY WARNING AND EVACUATION SAVES LIVES • The people who have timely early warning in conjunction with a community evacuation plan that facilitates getting out of harm’s way from the risks associated with storm surge, high winds, flooding, and landslides will survive.
THREE MAJOR FACTORS: GOOD COMMUNICATIONS GOOD MESSAGINGSAFE HAVENS FOR EVACUEES
LESSON: WIND ENGINEERED BUILDINGS SAVE LIVES • Buildings engineered to withstand the risks from a hurricane’s high velocity winds will maintain their function and protect occupants and users from death and injury.