Download
1 / 57
610 likes | 954 Views
Lecture 2: AGN Survey and Luminosity Function. Xiaohui Fan AGN Summer School, USTC May 25, 2007. Background: 46,420 Quasars from the SDSS Data Release Three. Goal. Derive the density of AGNs as function of bolometric luminosity, redshift (L bol , z, type) Relates to:

E N D
Lecture 2: AGN Survey and Luminosity Function Xiaohui Fan AGN Summer School, USTC May 25, 2007 Background: 46,420 Quasars from the SDSS Data Release Three
Goal • Derive the density of AGNs as function of bolometric luminosity, redshift • (Lbol, z, type) • Relates to: • Characterizing accretion history: • Distribution functions of black hole activity as function of MBH, accrection rate and radiative efficiency and redshift • Probing galaxy/BH coevolution • Test unification model
Basic Issues • Instead of (Lbol, z, type), we observe: • N(f, z, AGN type, selection criteria) • Selection effect • Incompleteness due to selection criteria (correctable) • Selection bias (e.g., optical survey missing obscured sources) • Bolometric correction • Redshift effect • Flux-limited vs. volume limited, truncated data set • Limited luminosity range at any given redshift, parametric vs. non-parametric • K-correction
Outline • AGN surveys • LF parameterization and selection effects • Evolution of optical AGN LFs • Density vs. luminosity evolution • Downsizing • Putting things together: • Soltan argument and constraints of BH accretion properties • Quasar Clustering
References • Textbook: • Peterson Chaps 10 and 11 • Recent Review • Osmer, astro-ph/0304150 • Optical • Richards et al. 2006, AJ, 131, 2766 • X-ray • Brandt and Hasinger, 2005, ARAA, 43, 827 • Luminosity function methodology • Fan et al. 2001, AJ, 121, 31 • Luminosity function across wavelength • Hopkins et al. 2007, ApJ, 654, 731 • Soltan argument • Yu and Tremaine 2002, MRNAS, 335, 965
Observational Properties of AGNs • Textbook definition • Small angular sizes (compact) • Cosmological distance • High luminosity? • Broad-band continuum emission • Emission Lines indicative of hard ionizing source • Variability • Polarization (subset) • AGN surveys utilize one or more of these properties
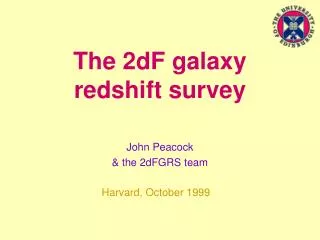
How to find AGNs • High luminosity AGNs: • LAGN >> Lgal • AGN light dominates • Point source in the wavelength observed • Distinct SED • Optical Color Selection • Sandage (1971) • 2dF (2000): • 400 deg2 • 25000 quasars
SDSS at Your Service Courtesy of Arizona graduate students
SDSS Overview • Primary Telescope: 2.5m wide-field (2.5 deg) • Imaging Survey (wide-field 54 CCD imager) • Main Survey: 10000 deg2 • Five bands, 3000 – 10000 Å • rlim ~ 22.5, zlim ~ 20.5 • Spectroscopic Survey • 106 galaxies (r<17.8) • 105 quasars ( 0 < z < 6.5) • Interesting stars, radio/x-ray sources etc.
SDSS Color Selection • Color selection • Type-1 quasars • Low-z • UV-excess (UVX), Palomar-Green (PG), 2dF etc. • Contaminants: brown dwarfs • High-z • Lyman break, SDSS, DPOSS, APM • Contaminants: late type stars, brown dwarfs • >90% of known AGNs are color-selected Stellar locus quasar Z=3 Z=4 Z=5 Richards et al. 2002
Selection effect of color selection • z=2.5-3.0 gap • Quasars have similar colors to F stars • Missing redder or reddened quasars • Missing obscured/type-2 objects • Only sensitive to high level of activity, high AGN/host contrast
Slitless Spectroscopy • Identify broad emission line from prism plates • Large Bright Quasar Survey (LBQS) • Hamburg ESO Survey (HES) • Palomar Grism Transit Survey • Selection Effect • Strong redshift dependence • Biases towards strong emission line • Mostly on photographic plates, difficult to calibrate • Problem with crowded field
X-ray Surveys Brandt and Hasinger 2005 • X-ray sky is dominated by AGNs • X-ray selection sensitive to both type-1 and modestly obscured type-2 sources • Chandra/XMM deep fields capable of reaching very low luminosity • Host galaxy not an issue until ~10-5~-6 Eddington luminosity
Other Selection Methods • Radio • Where everything started (Schmidt 1963) • ~10% quasars are radio-loud • FIRST and NVSS surveys • Does radio-loud quasars evolve the same way as radio-quiet ones? • Near-IR selection • KX (K-band excess) method • Less affected by reddening • mid-IR selection • Dust emission peaks at rest-frame 10-50 microns • Select both type 1 and type 2 • Can select Compton-thick sources • Variability • Proper motion survey • Serendipity (Spinrad method)
Quest to the Highest Redshift Quasars IR survey (UKIDSS, VISTA, LBT) SDSS APM CCD Radio
So how far could each of these techniques go? • Lyman break: • Quasars: 6.4 • Galaxies: 7-8 • Slitless spectroscopy • Quasars: 4.7 • Galaxies: 5.5 • multiwavelength • Quasars: 5.2 (X-ray), maybe 7? • Quasar: 5.8 (IR) • Quasar: 6.1 (radio) • Galaxies: 5.2 (radio) • Variability: • Quasar: 4.5 • Luck: • Quasars: 4.3 • Galaxies: 5.8
Surveys of low-luminosity AGNs • Low-luminosity type 1 and type 2 sources in X-ray samples • Emission-line selected sources in galaxy redshift surveys: • Optical wavelength: LAGN< L host • Spectra dominated by host galaxy; stellar/ISM component • CfA redshift survey sample (1980s) • Ho, Filippenko and Sargent (1997) sample: high S/N spectra of 486 nearby galaxies; half shows AGN signatures • SDSS selection: Hao et al., Kauffmann et al., Greene et al., Zakmaska et al. (excellent Ph . D. theses!!)
Selection of low-luminosity AGNs • Stellar spectra subtraction • Best-fit templates constructed from Principle Component Analysis • Bladwin-Phillips-Telrivich Digram • Separating AGNs from starbursts Hao et al. Kauffmann et al.
Two extremes from galaxy surveys • The smallest broad-line AGNs (Greene, Ho, Barth) Greene et al.
The most luminous type-2 quasars Zakamska et al.
Outline • AGN surveys • LF parameterization • Evolution of optical and X-ray selected AGNs • Density vs. luminosity evolution • Downsizing • The highest redshift quasars • Putting things together: • Soltan argument and constraints of BH accretion properties • Quasar Clustering
46,420 Quasars from the SDSS Data Release Three 5 Ly forest 3 Ly 2 CIV redshift CIII MgII FeII 1 FeII OIII H 0 wavelength 4000 A 9000 A
M-z distribution from SDSS Richards et al. 2006
Luminosity Functions:1/VA Estimator (non-parametric) Object Too Faint Given a single object, X, visible within some volume, VA Object Detectable For a number of objects i: Too Bright This 1/VA estimator is a maximum likelihood estimator Issue: Binning; selection effcts
Parameterization • SIMPLE POINTS: • There is no difference in PDE vs. PLE for power-law LF; • But LF will eventually turn over for the total number to converge; • The real LF is likely more complex
Parameterization • Quasar LF: double power-law • Luminosity-dependent density evolution (Schmidt and Green 1983): (L,z) = (L,z) (L,z=0) overall density evolves; Shape (bright and faint end slopes) evolves as well
Selection FunctionExample: optical color selection • Color of quasar is a function of: • Redshift • Spectral property: • Continuum slope • Emission line strength • For high-z : random distribution of absorption systems along line of sight • Luminosity: error distribution in the survey
f~- XF et al. 2001
Model selection function • Construct model quasar color sets that includes realistic distributions of quasar spectral properties and observed error distributions, then run selection algorithm on model data set • -> p(L,z,SED) • Limitations • Accuracy relies on assumptions on spectral property distributions (which sometimes is derived from the same survey) • Can never correct for objects that survey is insensitive to: optical: obscured sources, very red quasars etc. • Correction is large (and sensitive) in some cases (e.g. optical: z~2.8
Outline • AGN surveys • LF parameterization • Evolution of optical and X-ray selected AGNs • Density vs. luminosity evolution • Downsizing • The highest redshift quasars • Putting things together: • Soltan argument and constraints of BH accretion properties • Quasar Clustering
Luminosity Function from 2dF Quasar Survey Boyle et al. 2001
Luminosity function from 2QZ • Best fit model: pure luminosity evolution: : cosmic look-back time; L*() ~ exp(6) ~ 6; ~ -3.3; ~ -1.0 • However… • M* constant apparent mag • Selection effect?? • Faint end slope poorly determined • From 2001 to 2004 papers or L(z) ~ exp(6) Croom et al. 2004
What’s the Faint End Slope of QLF? • Faint slope measurement • Ranges from -1.o to -2.0… • lead to large uncertainties in in the total luminosity and mass density of quasar pop. z=0 Hao et al. 2004
SDSS quasar LF Richards et al. 2006
SDSS quasar LF • Strong evolution in bright end slope at z>3 • Can’t be luminosity evolution all the way • But doesn’t go faint enough at low-z to differentiate PLE from PDE or else Richards et al. 2006
density evolution of luminous quasars Density of quasars SFR of galaxies Bouwens et al. Exponential decline of quasar density at high redshift, different from normal galaxies Richards et al. 2006, Fan e al. 2005
X-ray AGN LF • Result 1: Downsizing of AGN activity • Quasar density peaks at z~2-3 • AGN density peaks at z~0.5 - 1 • Paradox 1: • Most of BH accretion happens in quasars at high-z • Most of X-ray background in Seyfert 2s at low-z
X-ray LF • Result 2: • PLE doesn’t work; need luminosity-dependent density evolution to characterize evolution of the entire LF Miyaji et al. 2006
X-ray LF • Result 3: • Type 2 fraction a strong function of luminosity • Paradox 2: • At high (quasar) luminosity: type 2 <20%; optical color selection is highly complete since all are type 1s, and includes most of luminosity AGN population emitted in the Universe • At low (Seyfert) luminosity: type 2 ~80%; optical color selection miss most of the AGNs in the Universe in terms of number
Outline • AGN surveys • LF parameterization • Evolution of optical and X-ray selected AGNs • Density vs. luminosity evolution • Downsizing • The highest redshift quasars • Putting things together: • Soltan argument and constraints of BH accretion properties • Quasar Clustering
Putting things together: Evolution of bolometric LF • Hopkins et al. (2007): • Combines QLFs in optical, X-ray and IR • Over z=0-6 and the whole L range • Accounting for distribution of absorbing column and luminosity-dependent SEDs • Findings: • PLE doesn’t work • Both bright and faint-end slope evolve with z • Luminosity-dependent density evolution provides good fit for all data
General Evolutionary Trends • And a calculator: www.cfa.harvard.edu/~phopkins/Site/qlf.html http://www.cfa.harvard.edu/~phopkins/Site/qlf.html ..
Putting things together: Soltan’s argument • Soltan’s argument: QSO luminosity function (L,t)traces the accretion history of local remnant BHs (Soltan 1982), if BH grows radiatively Total mass density accreted = total local BH mass density
New estimates of BH mass densities • Total local BH mass density: • local BH mass function nM(M,t0): • SDSS early-type galaxy sample n(,t0) (Bernardi et al. 2001) • the tight M• –relation (Tremaine et al. 2002) • •,local=(2.50.4)105 M/Mpc3 (h=0.65) (Yu & Tremaine 2002) • BH mass density accreted due to optically bright QSO phases: • (L,t): 2dF QSO Redshift survey (Boyle et al. 2000) • •,acc=2.1105[0.1(1- ) /] M/Mpc3 (Yu & Tremaine 2002) • Bright quasar phase can account for most of the BH mass growth; low efficiency accretion and obscured AGN not very important
The history of BH mass density accreted during quasar phase Yu and Tremaine 2002
Expanding Soltan’s Argument Fitting QLF with local BHMF
Outline • AGN surveys • LF parameterization • Evolution of optical and X-ray selected AGNs • Density vs. luminosity evolution • Downsizing • The highest redshift quasars • Putting things together: • Soltan argument and constraints of BH accretion properties • Quasar Clustering