Ensemble Baldwin Effect: Exploring Luminosity Correlations in Quasar Spectra
Analyzing correlations between luminosity, line equivalent width, and continuum luminosity in quasar spectra, exploring multiple Baldwin Effects, their implications, and possible explanations in the context of BLR physics. Discusses data, observations, and interpretative models.

Ensemble Baldwin Effect: Exploring Luminosity Correlations in Quasar Spectra
E N D
Presentation Transcript
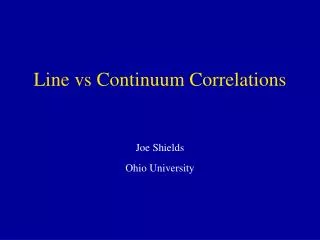
Line vs Continuum Correlations Joe Shields Ohio University
Baldwin (1977) • The “Baldwin Effect” - Carswell & Smith (1979) • Negative correlation between luminosity and line equivalent width
QSO spectra as function of luminosity (Dietrich et al. 2002)
Baldwin Effect Log L(line) Log EW Log L(continuum) Log L(continuum)
Baldwin Effect - Why Do We Care? • Originally cosmology • Early pattern emerging out of chaos of phenomenology • Indicator of broad-line region/accretion physics 30 years later: • Still interesting for BLR physics (see Baldwin 1999 for cosmology) • Much better data • Context has grown (PCA, EV1, black hole masses, L/Ledd, etc.) • EWs easy to measure 5
Multiple Baldwin Effects ? • Ensemble (“global”): single-epoch observations of multiple QSOs • Intrinsic: multi-epoch observations of a single, variable AGN • Broad lines • Narrow lines • X-ray (Fe K) • WR stars?? • Novae??
Ensemble Baldwin Effect: what do we know? UV/optical Broad Lines: • It exists • Formerly controversial • Lots of scatter common • Need sufficient range of L Kinney et al. 1990
Ensemble Baldwin Effect: what do we know? 2) Different slope for different lines • Steeper slope for higher ionization lines Dietrich et al. 2002 NV 1240 is an exception
Ensemble Baldwin Effect: lines of special interest • NV 1240 : • Most studies show no BE • Probable explanation: metallicity effect N/H Z2, higher Z goes with higher L (Hamann et al.) • Different behavior for NIII] 1750, NIV] 1486 (but weak lines) • H 4861 : • Recent studies show weak, inverse trend (negative BE) • Important for use of Balmer lines as tracer of luminosity (e.g., Greene & Ho 2005, X.B. Wu talk)
EW L0.2 EW L0.1 (2dF, Croom et al. 2002) (SDSS, Greene & Ho 2005)
Ensemble Baldwin Effect: explanations • Luminosity-dependent covering factor/ionization parameter (e.g. Mushotzky & Ferland 1984) • Luminosity-dependent continuum shape (e.g. Netzer et al. 1992, Korista et al. 1998) Another fundamental parameter correlated with luminosity? E.g. • redshift • L/Ledd • MBH 11
Ensemble Baldwin Effect: L vs. z Observational Problem: L strongly correlated with z in most samples (LBQS, Green et al. 2001) Log (z) Solution: fill in L-z plane (Dietrich et al. 2002)
Ensemble Baldwin Effect: L vs. z Bottom line: z dependence weak compared to L (Dietrich et al. 2002)
Ensemble Baldwin Effect: L vs. L/LEdd LEdd: derive from MBH based on linewidth, L BQS: Baskin & Laor 2004 Tighter correlation with L/LEdd (also Bachev et al. 2004)
Ensemble Baldwin Effect: L vs. L/LEdd Results for H: Netzer et al. 2004 Baldwin Effect in H ?? 15
Ensemble Baldwin Effect: L vs. L/LEdd Log EW Further correlations with L/LEdd Warner et al. 2004
Ensemble Baldwin Effect: a function of L or … Caution: L, L/Ledd, MBH often highly correlated Log L/LEdd Log L Warner et al. 2004
Ensemble Baldwin Effect: L/LEdd vs MBH Stronger correlation with MBH Warner et al., submitted
Ensemble Baldwin Effect: L vs MBH Warner et al., submitted Stronger correlation with MBH
Ensemble Baldwin Effect and PCA Results • Shang et al. (2003): • SPC1 mostly responsible for BE, • linked to L SPC3 linked to Boroson & Green EV1 L/LEdd or MBH Shang et al. 2003
Narrow-Line Seyfert 1s and the Baldwin Effect • Believed to be extreme EV1 or L/LEdd objects Osmer, Porter, & Green (1994) Constantin & Shields (2003) 21
Baldwin Effect in NLS1s UV Baldwin Effect • seen in NLS1s • Offset to smaller EWs Points: NLS1 sample Lines: Dietrich QSOs (Leighly & Moore 2004) (H shows negative trend also in NLS1s: Zhou et al. 2006) Is BE more uniform in L/LEdd ?
Ensemble Baldwin Effect: L vs. L/LEdd Triangles: NLS1 average Log EW Warner et al. 2004 Additional parameter involved
Intrinsic Baldwin Effect Example: NGC 4151 (Kong et al. 2006)
Intrinsic vs Ensemble Baldwin Effect Kinney et al. (1990) 25
Intrinsic Baldwin Effect: what do we know? • Steeper than ensemble BE • Causes may be quite different • Curvature seen • Tighter relation seen if lag removed (e.g., Pogge & Peterson 1992) (Lag is itself a function of L) • Consistent with photoionization theory (Korista, Goad, Cackett, Horne, Knigge, …) • Luminosity-dependent response a diagnostic tool for BLR
Intrinsic Baldwin Effect: what do we know? 4) Some evidence of ionization-dependent slope • e.g. CIV steeper than Ly • FeII: • Mixed results for slope (optical), e.g. NGC 5548 (Vestergaard & Peterson 2005), NGC 4051 (= NLS1; Wang et al. 2005) • FeII does respond to continuum photon excitation • Measuring FeII is hard! Wang et al. 2005
The Baldwin Effect in Narrow Lines • Detection claimed in several studies, esp. [O III] 5007 Log EW [NeV] [NeIII] [OII] MB (Also IR: Keremedjev & Hao) [OIII] 2dF: Croom et al. 2002
The Baldwin Effect in Narrow Lines Popular explanation: high L NLR reaches limiting size = galaxy size Implications for detection of Type II QSOs (e.g. Netzer et al. 2006) • Weak lines harder to find Implications for star formation and detection via nebular lines? (cf. Ho 2005: weak [OII]) • Star formation suppressed? Or confined to dense regions with low filling factor? Netzer et al. 2004
X-Ray Baldwin Effect: Fe K(Iwasawa & Taniguchi 1993) • Broad Fe K (Nandra 1997) • Probable origin: “reflection” from accretion disk • Models: luminosity-dependent ionization of disk (Nandra, Nayakshin), and gravitational light-bending (Miniutti & Fabian 2004) • Questions regarding broad component measurements • Narrow Fe K(e.g. Page et al. 2004) • Probable origin: reflection from outer disk or torus • Model: luminosity dependent covering factor (receding torus) • Due primarily to radio-loud sources with extra continuum component? (Jiang et al. 2006)
Summary • Baldwin Effect still significant for understanding AGN structure, physics • Seen in broad and narrow lines • BE calibration useful when shifting between measures of luminosity • Correlation with L may trace fundamental correlation(s) with MBH, L/Ledd, … no consensus yet? • Some disagreement regarding PCA connection • NLS1s outliers • Existence of X-ray Baldwin Effect uncertain • Sample details still very important Lots of progress, still work to do!