Download
1 / 21
210 likes | 332 Views
Learn how to use real-world data with Power View in Excel and SharePoint for interactive data exploration and powerful presentation experiences. Discover features like multiple views, automatic grouping, and graceful recovery from model changes. Dive deep into visualization conversions, SharePoint integration, and interactivity options. Explore the latest enhancements in SQL Server 2012 SP1, including hierarchies, KPIs, and geographic data. Compare different types of Power View reports and learn about Power View in disconnected scenarios. Enhance your BI skills and win a chance to get a Microsoft Surface Pro by completing the online session evaluation. Your feedback matters!

E N D
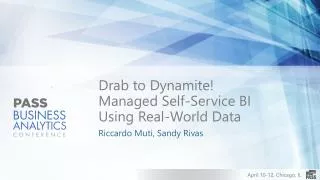
Drab to Dynamite!Managed Self-Service BI Using Real-World Data Riccardo Muti, Sandy Rivas
Agenda • What is Power View? • What’s new? • Power View in Excel and SharePoint • Creating reports • Features • Sneak peek
What is Power View? • An interactive data exploration, • visualization, and presentation experience.
What is Power View? Managed self-service BI Visual design experience Metadata-driven Presentation-ready at all times Connect to Excel Data Model Connect to Analysis Services
Traditional reporting Design Publish Preview (Render) Schedule Parameters Render Deliver SQL, AS, Oracle, SAP, Essbase, Teradata, OLE DB, ODBC, XML, …
Power View SQL, AS, Oracle, SAP, Essbase, Teradata, OLE DB, ODBC, XML, … Present, Share Explore, Interact Import into Data Model
Features in SQL Server 2012 RTM Model explorer and field list for model navigation and data region structure Multiple views in a single report Automatic grouping and aggregation Office-like shell with ribbon and canvas Graceful recovery from model changes Filters area with lists, numeric slider, calendar, and advanced mode Visualization conversions Common chart types, chart titles, axes, legend SharePoint integration (launch from library, manage, preview, PowerPivot Gallery) Interactivity: cross-filter, highlight, play axis, pop-out, transition animations, bubble trails… Table and matrix including totals and blocked layout External and database images Tab Strip and Tile Flow for data navigation Measures as non-measures Sorting Small multiples Show all (outer join) Motion charts Textboxes with rich text formatting View and data region level filtering with slicers and filter pane Non-measures as measures Drag-and-drop to Canvas
What’s new in SQL Server 2012 SP1 Model features Hierarchies KPIs Geographic data Hyperlink data Perspectives Style and formatting Themes Background colors Background images Embedded images Font size Hyperlinks Visualizations and interactivity Maps Pie charts Drill-down
Types of Power View reports • Power View report • .rdlx file • Contains only Power View sheets • Doesn’t contain a data model • All sheets connect to same external model • Excel workbook • .xlsx file • Can contain traditional Excel sheets and Power View sheets • Can contain a data model • Sheets can connect to the embedded data model or external models • Different sheets can connect to different models
Power View in Excel Excel Database server Power View SQL RS SQL AS (Tabular) ADOMD.NET SQL AS (PowerPivot)
Power View in SharePoint Browser SharePoint web server SharePoint app server Database server Excel Web App Excel Web Services Excel Calculation Services SQL AS (PowerPivot) Power View SQL AS (Tabular) ADOMD.NET SQL RS Add-In SQL RS
Key takeaways Excel: one app for modeling, analytics, visualization Workbooks: not just spreadsheets anymore Next-generation visualizations and interactivity Power View in disconnected scenarios SharePoint: share workbooks and interact in browser
Win a Microsoft Surface Pro! Complete an online SESSION EVALUATION to be entered into the draw. Draw closes April 12, 11:59pm CTWinners will be announced on the PASS BA Conference website and on Twitter. Go to passbaconference.com/evalsor follow the QR code link displayed on session signage throughout the conference venue. Your feedback is important and valuable. All feedback will be used to improve and select sessions for future events.
Thank you! Platinum Sponsor Diamond Sponsor