Download

1 / 57
570 likes | 850 Views
This course covers the role and types of inventory, EOQ approach, managing strategies like JIT and MRP, and inventory classifications. Gain insights into inventory costs, risk assessment, and carrying cost calculations. Understand the impact of inventory on financial statements, logistics costs, and functional areas in an organization.

E N D
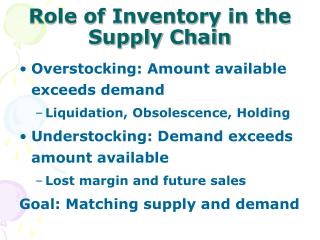
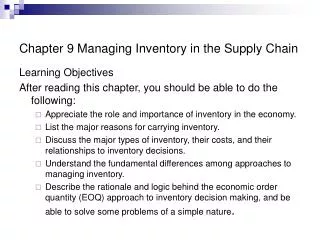
Learning Objectives • Appreciate the role and importance of inventory in the economy. • Understand the major reasons for carrying inventory. • Differentiate the major types of inventory, their costs, and their relationships to inventory decisions. • Understand the fundamental differences among approaches to managing inventory.
Learning Objectives, continued • Describe the rationale and logic behind the economic order quantity (EOQ) approach to inventory decision making, and be able to solve some problems of a simple nature. • Understand alternative approaches to managing inventory—just-in-time (JIT), materials requirement planning (MRP), distribution requirements planning (DRP), and vendor-managed inventory (VMI).
Learning Objectives, continued • Explain how inventory items can be classified. • Know how inventory will vary as the number of stocking points changes. • Make needed adjustments to the basic EOQ approach to respond to several special types of applications.
Introduction • Inventory is an asset on the balance sheet and a variable expense on the income statement. • Inventories also have an impact on return on investment (ROI) for an organization.
Inventory in the U.S. Economy • Nominal GDP grew by 106.7% between 1994 and 2010. • The value of inventory increased by 83.1% during the same time period. • Inventory costs as a percent of GDP declined from 15.9% in 1994 to 14.1% in 2010.
Table 9.1Macro Inventory vs. GDP Source: 22nd Annual State of Logistics Report, CSCMP 2011
Reasons for Inventory in the Firm • Batching Economies or Cycle Stocks • Arises from three sources. • procurement • production • transportation • Uncertainty and Safety Stocks • All organizations are faced with uncertainty. • On the demand side, there is usually uncertainty in how much customers will buy and when they will buy it.
Inventory in the Firm, continued • Uncertainty and Safety Stocks, continued • On the supply side, there might be uncertainty about obtaining what is needed from suppliers and how long it will take for the fulfillment of the order. • Time/In-Transit and Work-in-Process Stocks • The time associated with transportation means that even while goods are in motion, an inventory cost is associated with the time period. The longer the time, the higher the cost.
Inventory in the Firm, continued • Time/In-Transit and Work-in-Process Stocks, continued • WIP inventories, associated with manufacturing, can be significant while the length of time the inventory sits in a manufacturing facility waiting and should be carefully evaluated in relationship to scheduling techniques and the actual manufacturing/assembly technology. • Seasonal Stocks • Seasonality can occur in the supply of raw materials, in the demand for finished product, or in both. • Those faced with seasonality issues are constantly challenged when determining how much inventory to accumulate.
Inventory in the Firm, continued • Seasonal Stocks, continued • Seasonality can impact transportation. • Anticipatory Stocks • A fifth reason to hold inventory arises when an organization anticipates that an unusual event might occur that will negatively impact its source of supply. • Inventory in Support for Other Functional Areas • Logistics interfaces with an organization’s other functional areas. • Marketing • Manufacturing • Finance
Table 9.2Logistics Costs – 2010 Source: 22nd Annual State of Logistics Report, CSCMP 2011
Figure 9.1ABC Power Tools – In-Transit Inventory Analysis Source: Robert A. Novak, Ph.D.
Table 9.3ABC Power Tools In-Transit Inventory Analysis – Current Source: Robert A. Novak, Ph.D.
Table 9.4ABC Power Tools In-Transit Inventory Analysis – Proposed Source: Robert A. Novak, Ph.D.
Inventory Costs • Inventory Carrying Costs • Capital Cost (interest or opportunity cost) • cost of capital tied up in inventory and the resulting lost opportunity from investing that capital elsewhere • hurdle rate • weighted average cost of capital (WACC) • Storage Space Cost • Includes handling costs associated with moving products into and out of inventory, as well as such costs as rent, heat, and light. • Can be variable.
Inventory Costs, continued • Inventory Service Cost • Includes insurance and taxes. • Inventory Risk Cost • Reflects the possibility that inventory value might decline for reasons beyond firm’s control. • Calculating the Cost of Carrying Inventory • First, determine the value of the item stored in inventory. • Second, determine the cost of each individual carrying cost component to determine the total direct costs consumed by the item while being held in inventory. • Third, divide the total costs calculated in Step 2 by the value of the item determined in Step 1.
Table 9.5ABC Power Tools – Inventory Carrying cost for Item 1 Source: Robert A. Novak, Ph.D.
Table 9.6ABC Power Tools – Inventory Carrying cost for Item 1 to Customer Source: Robert A. Novak, Ph.D.
Table 9.7Inventory Carrying Costs for ABC Power Tools Source: Robert A. Novak, Ph.D.
Inventory Costs, continued • Order and Setup Cost • Order Cost • cost of placing order which may have both fixed and variable components • Setup Costs • expenses incurred each time an organization modifies a production or assembly line to produce a different item for inventory • Expected Stockout Cost • Back order - results in the vendor incurring incremental variable costs associated with processing the extra shipment. • Customer might decide to purchase a competitor’s product resulting in a direct loss for the supplier. • Customer might decide to permanently switch to a competitor’s product with loss of income.
Table 9.9Summary of Inventory and Order Cost Source: C. John Langley, Ph.D.
Figure 9.2Inventory Costs Source: C. John Langley, Ph.D.
Inventory Costs, continued • In-Transit Inventory Carrying Cost • Owner of product while it is in transit will incur resulting carrying costs. • In-transit inventory carrying cost becomes especially important on global moves since both distance and time from the shipping location both increase. • Owner should consider its delivery time part of its inventory carrying cost. • Key Differences Among Approaches to Managing Inventory • Dependent versus Independent Demand • independent when such demand is unrelated to the demand for other items • dependent when it is directly related, or derives from, the demand for another inventory item or product
Figure 9.3Safety Stocks and Service Levels Source: Robert A. Novak, Ph.D.
Figure 9.4Inventory and Service Levels Source: Robert A. Novak, Ph.D.
Inventory Costs, continued • Key Differences Among Approaches to Managing Inventory, continued • Pull versus Push • The “pull” approach relies on customer orders to move product through a logistics system, while the “push” approach uses inventory replenishment techniques in anticipation of demand to move products • Principle Approaches & Techniques for Inventory Management • Fixed order quantity model involves ordering a fixed amount of product each time reordering takes place
Inventory Costs, continued • Principle Approaches & Techniques for Inventory Management, continued • Simple EOQ Model • The following are the basic assumptions of the simple EOQ model: • A continuous, constant, and known rate of demand • A constant and known replenishment or lead time • All demand is satisfied • A constant price or cost that is independent of the order quantity (i.e., no quantity discounts) • No inventory in transit • One item of inventory or no interaction between items • Infinite planning horizon • Unlimited capital
Figure 9.5Fixed Order Quantity Model with Certainty Source: John C. Coyle, DBA
Figure 9.8Inventory Costs Source: John C. Coyle, DBA
Inventory Costs, continued • Principle Approaches & Techniques for Inventory Management, continued • Simple EOQ Model, continued • Mathematical formulation
Figure 9.11Graphical Representation of EOQ Source: C. John Langley, Ph.D.
Figure 9.12Fixed Order Quantity with Uncertainty Source: John C. Coyle, DBA
Figure 9.13Normal Distribution Source: John C. Coyle, DBA
Additional Approaches to Inventory Management • The Just-in-Time (JIT) Approach • Four major elements underlie the JIT approach. • zero inventories (?) • short, consistent lead times • small, frequent replenishment quantities • high quality, or zero defects • Materials Requirements Planning • Deals specifically with supplying materials and component parts whose demand depends on the demand for a specific end product.
Additional Approaches to Inventory Management, continued • Materials Requirements Planning, continued • Consists of a set of logically related procedures, decision rules, and records designed to translate a master production schedule into time-phased net inventory requirements and the planned coverage of such requirements for each component item needed to implement this plan. • Uses the following elements: • Master production schedule (MPS) • Bill of materials file (BOM) • Inventory status file (ISF) • MRP program • Outputs and reports
Figure 9.18Normal Distribution Source: Adapted from William M. Boyst III, “JIT American Style”, Proceedings of the 1988 conference of the American Production and Inventory Control Society (1988) 468
Figure 9.15An MRP System Source: John C. Coyle, DBA
Figure 9.16MRP Egg Timer Example Source: John C. Coyle, DBA
Table 9.19Inventory Status File: MRP Egg Timer Example Source: John C. Coyle, DBA
Figure 9.17Master Schedule: MRP Egg Timer Example Source: John C. Coyle, DBA
Additional Approaches to Inventory Management, continued • Distribution Requirements Planning (DRP) • Purpose is to more accurately forecast demand and to explode that information back to develop production schedules. • Firm can minimize inbound inventory in conjunction with production schedules. • Outbound (finished goods) inventory is minimized • DRP develops a projection for each SKU requiring the following: • Forecast of demand for each SKU • Current inventory level of the SKU (balance on hand, BOH) • Target safety stock • Recommended replenishment quantity • Lead time for replenishment
Table 9.20DRP Table for Chicken Soup Source: A.J. Stenger, “Distribution Resources Planning”, Penn State Univ. class example
Additional Approaches to Inventory Management, continued • Vendor-Managed Inventory (VMI) • The basic principles: • The supplier and its customer agree on which products are to be managed using in the customer’s distribution centers. • An agreement is made on reorder points and economic order quantities for each of these products. • As these products are shipped from the customer’s distribution center, the customer notifies the supplier, by SKU, of the volumes shipped on a real-time basis.
Figure 9.19Inventory Management Techniques in the Logistics Network Source: Robert A. Novak, Ph.D.
Classifying Inventory • ABC Analysis • Assigns inventory items to one of three groups according to the relative impact or value of the items. • A items are considered to be the most important • B items being of lesser importance • C items being the least important • Pareto’s Law, or the “80–20 Rule” • Many situations were dominated by a relatively few vital elements
Figure 9.20ABC Inventory Analysis Source: John C. Coyle, DBA
Table 9.21ABC Analysis for Big Orange Source: John C. Coyle, DBA
Figure 9.21Quadrant Model (another technique to classify inventory) Source: Robert A. Novak, Ph.D.
Classifying Inventory, continued • Inventory at Multiple Locations—The Square-Root Rule • The square-root rule states that total safety stock inventories in a future number of facilities can be approximated by multiplying the total amount of inventory in existing facilities by the square root of the number of future facilities divided by the number of existing facilities.