Download
1 / 67
860 likes | 1.55k Views
Chapter 10 Managing Economies of Scale in the Supply Chain: Cycle Inventory. Supply Chain Management (3rd Edition). Outline. Role of Cycle Inventory in a Supply Chain Economies of Scale to Exploit Fixed Costs Economies of Scale to Exploit Quantity Discounts

E N D
Chapter 10Managing Economies of Scale in the Supply Chain: Cycle Inventory Supply Chain Management(3rd Edition)
Outline • Role of Cycle Inventory in a Supply Chain • Economies of Scale to Exploit Fixed Costs • Economies of Scale to Exploit Quantity Discounts • Short-Term Discounting: Trade Promotions • Managing Multi-Echelon Cycle Inventory • Estimating Cycle Inventory-Related Costs in Practice
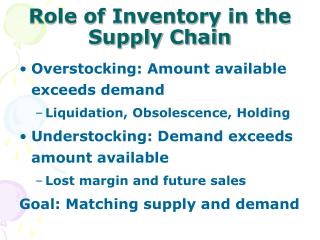
Role of Inventory in the Supply Chain Cost Availability Responsiveness Efficiency
Role of Cycle Inventoryin a Supply Chain • Lot, or batch size: quantity that a supply chain stage either produces or orders at a given time • Cycle inventory: average inventory that builds up in the supply chain because a supply chain stage either produces or purchases in lots that are larger than those demanded by the customer • Q = lot or batch size of an order • D = demand per unit time Cycle inventory = Q/2 (depends directly on lot size) • Average flow time = Avg inventory / Avg flow rate Average flow time from cycle inventory = Q/(2D)
An Inventory System D Average Inv. Level D
Role of Cycle Inventoryin a Supply Chain Q = 1000 units D = 100 units/day Cycle inventory = Q/2 = 1000/2 = 500 = Avg inventory level from cycle inventory Avg flow time = Q/2D = 1000/(2)(100) = 5 days • Cycle inventory adds 5 days to the time a unit spends in the supply chain • Lower cycle inventory is better because: • Average flow time is lower • Working capital requirements are lower • Lower inventory holding costs
Role of Cycle Inventoryin a Supply Chain • Cycle inventory is held primarily to take advantage of economies of scale in the supply chain • Supply chain costs influenced by lot size: • Material cost = C • Fixed ordering cost = S • Holding cost = H = hC (h = cost of holding $1 in inventory for one year) • Primary role of cycle inventory is to allow different stages to purchase product in lot sizes that minimize the sum of material, ordering, and holding costs • Ideally, cycle inventory decisions should consider costs across the entire supply chain, but in practice, each stage generally makes its own supply chain decisions – increases total cycle inventory and total costs in the supply chain
Economies of Scaleto Exploit Fixed Costs • How do you decide whether to go shopping at a convenience store or at Sam’s Club? • Lot sizing for a single product (EOQ) • Aggregating multiple products in a single order • Lot sizing with multiple products or customers • Lots are ordered and delivered independently for each product • Lots are ordered and delivered jointly for all products • Lots are ordered and delivered jointly for a subset of products
Economies of Scaleto Exploit Fixed Costs Annual demand = D Number of orders per year = D/Q Annual material cost = CD Annual order cost = (D/Q)S Annual holding cost = (Q/2)H = (Q/2)hC Total annual cost = TC = CD + (D/Q)S + (Q/2)hC Figure 10.2 shows variation in different costs for different lot sizes
Fixed Costs: Optimal Lot Sizeand Reorder Interval (EOQ) D: Annual demand S: Setup or Order Cost C: Cost per unit h: Holding cost per year as a fraction of product cost H: Holding cost per unit per year Q: Lot Size T: Reorder interval Material cost is constant and therefore is not considered in this model
Example 10.1 Demand, D = 12,000 computers per year d = 1000 computers/month Unit cost, C = $500 Holding cost fraction, h = 0.2 Fixed cost, S = $4,000/order Q* = Sqrt[(2)(12000)(4000)/(0.2)(500)] = 980 computers Cycle inventory = Q/2 = 490 Flow time = Q/2d = 980/(2)(1000) = 0.49 month Reorder interval, T = 0.98 month
Example 10.1 (continued) Annual ordering and holding cost = = (12000/980)(4000) + (980/2)(0.2)(500) = $97,980 Suppose lot size is reduced to Q=200, which would reduce flow time: Annual ordering and holding cost = = (12000/200)(4000) + (200/2)(0.2)(500) = $250,000 To make it economically feasible to reduce lot size, the fixed cost associated with each lot would have to be reduced
Example 10.2 If desired lot size = Q* = 200 units, what would S haveto be? D = 12000 units C = $500 h = 0.2 Use EOQ equation and solve for S: S = [hC(Q*)2]/2D = [(0.2)(500)(200)2]/(2)(12000) = $166.67 To reduce optimal lot size by a factor of k, the fixed order cost must be reduced by a factor of k2
Key Points from EOQ Model • In deciding the optimal lot size, the tradeoff is between setup (order) cost and holding cost. • If demand increases by a factor of 4, it is optimal to increase batch size by a factor of 2 and produce (order) twice as often. Flow time should decrease as demand increases. • If lot size is to be reduced, one has to reduce fixed order cost. To reduce lot size by a factor of 2, order cost has to be reduced by a factor of 4.
Aggregating Multiple Productsin a Single Order • Transportation is a significant contributor to the fixed cost per order • Can possibly combine shipments of different products from the same supplier • same overall fixed cost • shared over more than one product • effective fixed cost is reduced for each product • lot size for each product can be reduced • Can also have a single delivery coming from multiple suppliers or a single truck delivering to multiple retailers • Aggregating across products, retailers, or suppliers in a single order allows for a reduction in lot size for individual products because fixed ordering and transportation costs are now spread across multiple products, retailers, or suppliers
Example: Aggregating Multiple Products in a Single Order • Suppose there are 4 computer products in the previous example: Deskpro, Litepro, Medpro, and Heavpro • Assume demand for each is 1000 units per month • If each product is ordered separately: • Q* = 980 units for each product • Total cycle inventory = 4(Q/2) = (4)(980)/2 = 1960 units • Aggregate orders of all four products: • Combined Q* = 1960 units • For each product: Q* = 1960/4 = 490 • Cycle inventory for each product is reduced to 490/2 = 245 • Total cycle inventory = 1960/2 = 980 units • Average flow time, inventory holding costs will be reduced
Lot Sizing with MultipleProducts or Customers • In practice, the fixed ordering cost is dependent at least in part on the variety associated with an order of multiple models • A portion of the cost is related to transportation (independent of variety) • A portion of the cost is related to loading and receiving (not independent of variety) • Three scenarios: • Lots are ordered and delivered independently for each product • Lots are ordered and delivered jointly for all three models • Lots are ordered and delivered jointly for a selected subset of models
Lot Sizing with Multiple Products • Demand per year • DL = 12,000; DM = 1,200; DH = 120 • Common transportation cost, S = $4,000 • Product specific order cost • sL = $1,000; sM = $1,000; sH = $1,000 • Holding cost, h = 0.2 • Unit cost • CL = $500; CM = $500; CH = $500
Delivery Options • No Aggregation: Each product ordered separately • Complete Aggregation: All products delivered on each truck • Tailored Aggregation: Selected subsets of products on each truck
No Aggregation: Order Each Product Independently Total cost = $155,140
Complete Aggregation: Order AllProducts Jointly S* = S + sL + sM + sH = 4000+1000+1000+1000 = $7000 n* = Sqrt[(DLhCL+ DMhCM+ DHhCH)/2S*] = 9.75 QL = DL/n* = 12000/9.75 = 1230 QM = DM/n* = 1200/9.75 = 123 QH = DH/n* = 120/9.75 = 12.3 Cycle inventory = Q/2 Average flow time = (Q/2)/(weekly demand)
Complete Aggregation:Order All Products Jointly Annual order cost = 9.75 × $7,000 = $68,250 Annual total cost = $136,528 (No aggragation cost is $155,140)
Tailored Aggregation: An Heuristic Approach • Which products should be ordered jointly? • Identify the product which is ordered most frequently. • For each successive product i, identify the frequency mi, where product i is ordered every mi deliveries, i=1,2,...,n. Not necessarily optimal, but close to optimal! • Given: • Di , Ci , S, si.
Algorithm: • Step 1: Assuming independent ordering, find the most frequently ordered product • Step 2: Calculate the order frequency of each product as a multiple of . and
Algorithm (cont’d.) • Step 3: Recalculate the ordering frequency of the most frequently ordered product, Most frequently ordered product is ordered each time. Others are ordered in every mi orders, so their contribution to fixed cost of order is . • Step 4: For each product evaluate an order frequency
Example: Best Buy Co. S=$4,000, sL = sM = sH = $1000 DL = 12,000; DM = 1,200; DH = 120 Step 1: Calculate most frequently ordered model Step 2: Calculate the frequency of M and H.
Example: Best Buy Co. Step 3: Recalculate the ordering frequency of the most frequently ordered model L. Step 4: Recalculate the frequency of M and H.
Tailored Aggregation:Order Some Products Jointly Annual order cost = Annual holding cost=$69,444 Annual total cost = $131,004 (4% reduction in complete aggregation cost.)
Lessons from Aggregation • Aggregation allows firm to lower lot size without increasing cost • Complete aggregation is effective if product specific fixed cost is a small fraction of joint fixed cost • Tailored aggregation is effective if product specific fixed cost is a large fraction of joint fixed cost
Quantity Discounts What happens if the material cost, C is not a constant? Types of discounts: • Lot size based (quantity purchased in a single order) • All units quantity discounts • Marginal unit quantity discounts • Volume based (quantity purchased in a period) Questions: • How should buyer react to maximize profit? • How is the SC affected? Lotsizes, cycle inventories, flow times, etc. • When is it appropriate for the supplier to offer discounts?What are appropriate discounting schemes?
All-Unit Quantity Discounts • The unit cost generally decreases as the quantity increases, i.e., C0>C1>…>Cr • The objective for the company (a retailer in our example) is to decide on a lot size that will minimize the sum of material, order, and holding costs
Costs of Quantity Discounts Model Total Cost Order quantity,q
All-Unit Quantity Discount Procedure (different from what is in the textbook) Step 1: Calculate the EOQ for the lowest price. If it is feasible (i.e., this order quantity is in the range for that price), then stop. This is the optimal lot size. Calculate TC for this lot size. Step 2: If the EOQ is not feasible, calculate the TC for this price and the smallest quantity for that price. Step 3: Calculate the EOQ for the next lowest price. If it is feasible, stop and calculate the TC for that quantity and price. Step 4: Compare the TC for Steps 2 and 3. Choose the quantity corresponding to the lowest TC. Step 5: If the EOQ in Step 3 is not feasible, repeat Steps 2, 3, and 4 until a feasible EOQ is found.
All-Unit Quantity Discounts: Example Cost/Unit Total Material Cost $3 $2.96 $2.92 10,000 10,000 5,000 5,000 Order Quantity Order Quantity
All-Unit Quantity Discount: Example Order quantity Unit Price 0-5000 $3.00 5001-10000 $2.96 Over 10000 $2.92 q0 = 0, q1 = 5000, q2 = 10000 C0 = $3.00, C1 = $2.96, C2 = $2.92 D = 120000 units/year, S = $100/lot, h = 0.2
All-Unit Quantity Discount: Example Step 1: Calculate Q2* = Sqrt[(2DS)/hC2] = Sqrt[(2)(120000)(100)/(0.2)(2.92)] = 6410 bottles Not feasible (6410 < 10001) Calculate TC2 using C2 = $2.92 and q2 = 10001 TC2 = (120000/10001)(100)+(10001/2)(0.2)(2.92)+(120000)(2.92) = $354,520 Step 2: Calculate Q1* = Sqrt[(2DS)/hC1] =Sqrt[(2)(120000)(100)/(0.2)(2.96)] = 6367 bottles Feasible (5000<6367<10000) Stop TC1 = (120000/6367)(100)+(6367/2)(0.2)(2.96)+(120000)(2.96) = $358,969 Step 4: TC2 < TC1 The optimal order quantity Q* is 10001
Notes on All-Unit Quantity Discounts • What is the effect of such a discount schedule? • Retailers are encouraged to increase the size of their orders (optimal order quantity increases to 10,001 bottles from 6,324 bottles) • Average flow time is increased • Average inventory (cycle inventory) in the supply chain is increased Is an all-unit quantity discount an advantage in the supply chain? • Suppose fixed order cost were reduced to $4 (from $100) • Without discount, Q* would be reduced to 1265 units from 6,324 bottles • With discount, optimal lot size would still be 10001 units • Quantity discount leads to 8 times increase in average inventory as well as flow time !!!! The impact is magnified if the fixed cost is smaller!
Marginal-Unit Quantity Discounts Cost/Unit Total Material Cost $3 $2.96 $2.92 10,000 10,000 5,000 5,000 Order Quantity Order Quantity
Marginal-Unit Quantity Discounts • Also have been referred to as multiple-tariffs. • It is not the average cost but the marginal cost per unit that decreases at a breakpoint, • Let be the cost of ordering units, and Q be the order quantity,
Marginal-Unit Quantity Discounts If then, Otherwise, the optimal solution is in another range.
Marginal-Unit Quantity Discount: Example: Drugs on line Ex: DO, Online retailer of prescription drugs and health supplements Order quantity Marginal Unit Price 0-5000$3.00 (C0) 5001-10000 $2.96 (C1) Over 10000 $2.92 (C2) D = 120000 units/year, S = $100, h = 0.2 $/$/year
Notes on Marginal-Unit Quantity Discount • Lot size is increased to 16,961 from 6,324 by offering a marginal unit quantity discount. Is a marginal-unit quantity discount an advantage in the supply chain? • If the fixed order cost is $4 (instead of $100), the optimal lot size for DO is 15,755 (with the discount), compared to 1,265 (without the discount). The impact on lot size is magnified if the fixed cost is smaller!
Why Quantity Discounts? • Improved coordination in the supply chain A SC is coordinated if both the manufacturer and the retailer make decisions to maximize SC profits. How can a manufacturer use appropriate quantity discounts to ensure that coordination is achieved even if the retailer is acting to maximize its own profits given its cost structure? • Extraction of surplus through price discrimination SC has multiple retailers each with different demand structure all supplied by a single manufacturer. Firm charges different prices to maximize profits. Ex:Passengers travelling on the same plane often pay different prices. What is the form of discount scheme to be offered?
Quantity Discounts forCommodity Products • D = 120,000 bottles/year • SR = $100, hR = 0.2, CR = $3 Lot Size =6,324 • SM = $250, hM = 0.2, CM = $2 Supply chain cost = $9,804
Quantity Discounts forCommodity Products • What can the supplier do to decrease supply chain costs? Coordinated lot size: 9,165 • Retailer cost = $4,059Supply chain cost = $9,165 • Manufacturer cost = $5,106
Pricing Schemes for Coordination: Commodity Products • Effective pricing schemes • Marketing can offer all-unit quantity discount • $3 for lots below 9,165 • $2.71 for lots of 9,165 or more • Manufacturing pass some fixed cost to retailer (enough that he raises order size from 6,324 to 9,165) Optimal lot size for retailer is 9165
Key Notes for Quantity Discounts in Commodity Products • For commodity products where price is set by the market, lot size based quantity discount is appropriate to achieve coordination. • However lot size based discount increases cycle inventory. • Often firms find that significant efforts to reduce order costs do not reduce inventory in the SC because of quantity discounts, so coordination is required! So as the manufacturer lowers his setup cost, the discount he offers to retailers should change!
Quantity Discounts WhenFirm Has Market Power Manufacturer invents a new vitamin pill. Few or no competitors! • Demand curve faced by DO is affected by the price as 360,000 - 60,000p • What are the optimal prices and profits in the following situations if CM = $2/bottle? • The two stages make the pricing decision independently • Price of manufacturer= CR = $4/bottle, • Price of DO=p=$5/bottle Demand = 60,000 • Profit = PM+PR=$120,000+ $60,000=$180,000
Quantity Discounts WhenFirm Has Market Power • The two stages coordinate the pricing decision • p = $4, CR=2, Demand = 120,000 bottles, • Profit = PM+PR=0+240,000 = $240,000 ($60,000 higher.) • The SC profit is lower if each stage of the SC independently takes its pricing decisions with the objective of maximizing its own profit! p CR CM M R