Download

1 / 84
840 likes | 912 Views
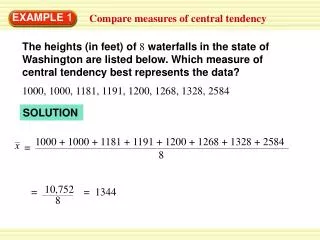
You can calculate: Central tendency Variability You could graph the data. You can calculate: Central tendency Variability You could graph the data. Bivariate Distribution. Positive Correlation. Positive Correlation. Regression Line. Correlation. r = 1.00. Regression Line. r = .64.

E N D
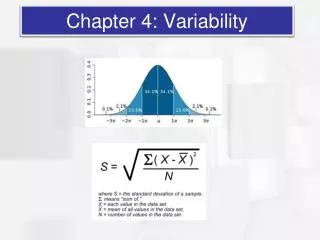
You can calculate: Central tendency Variability You could graph the data
You can calculate: Central tendency Variability You could graph the data
Correlation r = 1.00
Regression Line . . . . . r = .64
Regression Line . . . . . r = .64
Regression Line . . . . .
Regression Line . . . . .
Negative Correlation r = - 1.00
Negative Correlation . . . r = - .85 . .
Zero Correlation . . . . . r = .00
Correlation Coefficient • The sign of a correlation (+ or -) only tells you the direction of the relationship • The value of the correlation only tells you about the size of the relationship (i.e., how close the scores are to the regression line)
Which is a bigger effect? r = .40 or r = -.40 How are they different?
Interpreting an r value • What is a “big r” • Rule of thumb: Small r = .10 Medium r = .30 Large r = .50
Practice • Do you think the following variables are positively, negatively or uncorrelated to each other? • Alcohol consumption & Driving skills • Miles of running a day & speed in a foot race • Height & GPA • Forearm length & foot length • Test #1 score and Test#2 score
Statistics Needed • Need to find the best place to draw the regression line on a scatter plot • Need to quantify the cluster of scores around this regression line (i.e., the correlation coefficient)
Covariance • Correlations are based on the statistic called covariance • Reflects the degree to which two variables vary together • Expressed in deviations measured in the original units in which X and Y are measured
Note how it is similar to a variance • If Ys were changed to Xs it would be s2 • How it works (positive vs. negative vs. zero)
Ingredients: ∑XY ∑X ∑Y N
∑XY = 84 ∑Y = 23 ∑X = 15 N = 5
∑XY = 84 ∑Y = 23 ∑X = 15 N = 5
∑XY = 84 ∑Y = 23 ∑X = 15 N = 5
∑XY = 84 ∑Y = 23 ∑X = 15 N = 5
∑XY = 84 ∑Y = 23 ∑X = 15 N = 5
Problem! • The size of the covariance depends on the standard deviation of the variables • COVXY = 3.75 might occur because • There is a strong correlation between X and Y, but small standard deviations • There is a weak correlation between X and Y, but large standard deviations
Solution • Need to “standardize” the covariance • Remember how we standardized single scores
Practice • You are interested in if candy intake is related to childhood depression. You collect data from 5 children.
Practice Scandy = 1.52 Sdepression = 24.82