
EXAMPLE 1
1000 + 1000 + 1181 + 1191 + 1200 + 1268 + 1328 + 2584. 8. =. 10,752. =. x. 8. EXAMPLE 1. Compare measures of central tendency. The heights (in feet) of 8 waterfalls in the state of Washington are listed below. Which measure of central tendency best represents the data?.

EXAMPLE 1
E N D
Presentation Transcript
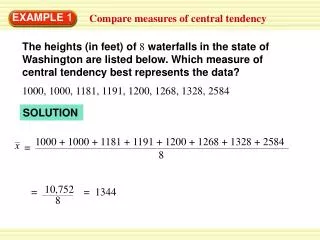
1000 + 1000 + 1181 + 1191 + 1200 + 1268 + 1328 + 2584 8 = 10,752 = x 8 EXAMPLE 1 Compare measures of central tendency The heights (in feet) of 8 waterfalls in the state of Washington are listed below. Which measure of central tendency best represents the data? 1000, 1000, 1181, 1191, 1200, 1268, 1328, 2584 SOLUTION = 1344
ANSWER The median best represents the data. The mode is significantly less than most of the data, and the mean is significantly greater than most of the data. EXAMPLE 1 Compare measures of central tendency The median is the mean of the two middle values,1191and1200, or1195.5. The mode is 1000.
ANSWER Median; the median, 1191, is close to the data points. for Example 1 GUIDED PRACTICE 1. WHAT IF?In Example 1, suppose you eliminate the greatest data value, 2584. Which measure of central tendency best represents the remaining data? Explain your reasoning.


