Download
1 / 22
220 likes | 306 Views
Engage in discussions on scientific findings, observational plans, data sharing policies, and future initiatives in the CLIMODE project.

E N D
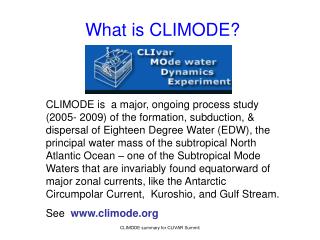
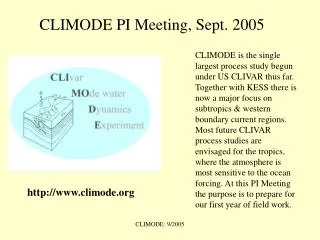
CLIMODE PI Meeting, Sept. 2005 CLIMODE is the single largest process study begun under US CLIVAR thus far. Together with KESS there is now a major focus on subtropics & western boundary current regions. Most future CLIVAR process studies are envisaged for the tropics, where the atmosphere is most sensitive to the ocean forcing. At this PI Meeting the purpose is to prepare for our first year of field work. http://www.climode.org CLIMODE: 9/2005
CLIMODE PI Meeting-2 • present & discuss new scientific results/ideas that might impact CLIMODE thinking and the upcoming field program • Get to specifics of logistics for deployments in our first field year, beginning in November & including a Jan/Feb cruise • What data/model output sharing policies do we need to follow to inform PIs of what is available & allow sharing of these results within CLIMODE? • Make ourselves aware of other, related work either funded or planned that may impact CLIMODE [KESS, Lozier, Bane, Doney, Ferrari] CLIMODE: 9/2005
CLIMODE PI Meeting-3 Agenda- September 19 0800 – 0900 Continental Breakfast 0900 – 0930 Welcome, logistics, agenda (Joyce) 0930 – 1030 Scientific Issues for CLIMODE (Marshall) 1030 – 1045 Coffee Break 1045 – 1200 Scientific Issues, cont. (Marshall et al.) 1200 – 1300 Lunch 1300 – 1500 Observational Plans (Fratantoni: Moored & Lagrangian) 1500 – 1515 Coffee Break 1515 – 1730 Observational Plans, cont. (Joyce: upcoming cruises) 1800 - Dinner Agenda-September 20 0800 – 0900 Continental Breakfast 0900 – 1030 Observational Plans, cont. (Kelly: satellite, radiosondes, mesoscale modeling, aircraft) 1030 – 1045 Coffee Break 1045 – 1200 Data & Model output tracking & sharing (Joyce) 1200 – 1300 Lunch 1300 – 1400 New initiatives/proposals, CLIVAR CPT Interaction 1400 – 1500 Unfinished Business, AGU Session for next PI Meeting? 1500 - Adjourn CLIMODE: 9/2005
Some ideas about Air-Sea Interaction, T. Joyce CLIMODE constantly has to work to maintain recognition as a major US CLIVAR process study. What we are up against is what I like to call the “tropical bias”: the tropics are where the air-sea coupling is most crucial because the atmosphere responds best to the ocean there. But is this tropical bias warranted? Does the mid-latitude atmosphere respond vigorously to the ocean? Anywhere? Can CLIMODE address this? T. Joyce presentation at CLIMODE PI Meeting, 9/05 CLIMODE: 9/2005
Some ideas – Joyce 2 From A22 cruise in November 2004, the Gulf Stream (GS) is covered by low clouds & localized convection. Stations 66 – 72 span the Gulf Stream & these have been used to characterize GS structure in ‘stream’ coordinates at a previous PI Meeting in 2004 at http://www.climode.org/Meetings/NOV_04/joyce_nov04.pdf. Here I would like to discuss the clouds seen mostly over the meandering GS. CLIMODE: 9/2005
Some ideas– Joyce 3 The mean annual evaporation over the GS is a maximum for the N. Hemisphere & shows, in this NCEP product for 1979-2003, a loss of water at a rate of 5-7 mm/d, expressed in terms of water loss instead of the usual heat flux (5 mm/d 150 W/m2). This water vapor goes into the atmosphere where it potentially spreads widely. CLIMODE: 9/2005
Some ideas– Joyce 4 Precipitation estimates (CMAP, mm/d) based on blended data from 5 satellites allows an estimate of the mean annual precipitation for the same 1979-2003 period. Unlike some previous summaries, this product shows that most of the evaporation over the GS precipitates out before it leaves the area. Clearly the atmosphere is responding quickly to the ocean forcing. CLIMODE: 9/2005
Some ideas – Joyce 5 CMAP data indicate that most precipitation (mm/d) falls in the winter months, when the evaporative loss is also the greatest. CLIMODE: 9/2005
Some ideas– Joyce 6 A U. Wisconsin study of cloud heights using high resolution infrared sounders from polar-orbiting satellites has shown that more than 60% of the wintertime clouds over the GS are above 5 km, the middle of the troposphere, over 40% above 9 km. CLIMODE: 9/2005
Some ideas– Joyce 7 While the winter months NCEP Evaporation (left) may be of questionable absolute accuracy, one can see enhanced Evaporation over the ocean which appears off N. Carolina with increased Precipitation (middle) somewhat ‘downstream’ along the storm track, suggesting a rapid but not instantaneous atmospheric response & a decaying E-P signal (right). CLIMODE: 9/2005
Some ideas– Joyce 8 • Most of evaporative loss over GS heat exchange “bullseye” is recycled locally as precipitation • Latent heat release in atmosphere over GS can ‘locally’ power convection in atmosphere which can reach into the middle-upper troposphere • This cloud/precip signal demarks the location of the extra-tropical storm track over the N. Atlantic • CLIMODE needs to establish the height of the atmosphere responding to air-sea exchange over the GS and the EDW • How sensitive is this to the strength & meridional location of the hotspot? CLIMODE: 9/2005
CMAP & NCEP (mm/d) Joyce 9 CMAP (left) & NCEP (right) mean Precipitation are similar over the Gulf Stream but diverge greatly in the tropics (e.g. lower part of figures). CLIMODE: 9/2005
WHOI & NCEP (mm/d) Joyce 10 NCEP (left) & WHOI (L. Yu, right) mean Latent Flux also differ substantially from each other, especially in the tropics. CLIMODE will help sort out these & other flux differences. CLIMODE: 9/2005
CLIMODE Cruise Schedule CLIMODE: 9/2005
Winter Cruise Plans– Joyce 1 • For initial winter cruise the R/V Atlantis (Late Jan/early Feb, 14 days scheduled) we will do the following: • Deploy & follow compound spar with CTD stations, ADCP profiling, air-sea DC fluxes & radiosonde releases. • Develop downstream evolution of cross stream structure in upper ocean and lower-mid troposphere, compare ship DC fluxes with spar, surface buoy. • Deploy surface drifters, subsurface floats CLIMODE: 9/2005
Winter Cruise Plans– Joyce 2 Where the Gulf Stream leaves the coast near Cape Hatteras, microwave sensors on satellites provide geostrophic surface ocean currents (vectors), while satellite microwave imaging of sea surface temperature (colors) provides near all weather coverage. Locations of CLIMODE mooring are shown as white symbols. CLIMODE: 9/2005
Winter Cruise Plans– Joyce 3 Using previous image as an example, here we show a cruise track for the R/V Atlantis in Jan/Feb 2006. After steaming across Gulf Stream (GS) south of Woods Hole, the vessel will deploy the drifting compound spar, “S”, and proceed to re-cross the GS making CTDs and radio-sondes following the spar as it drifts with the flow. Deployments of floats & drifters & additional CTD stations need to be planned around this strawman. The Weller-Edson Met. mooring is at “F”. F CLIMODE: 9/2005
Winter Cruise Plans– Joyce 4 Known PI groups going on winter cruise in 2006 Joyce (4 + 1-2 students) Toole (people?) Edson (people?), # radiosondes? Fratantoni (people?), # floats? Lumpkin (people?), # floats? Talley (people?), # floats? Lozier (people?) CLIMODE: 9/2005
CLIMODE Data Issues 1 • In a program as complicated as CLIMODE, with multiple PIs at different Institutions, all needing access to data and model “products”, we need some data system to assist us. Since we, as a program, budgeted $ 0.00 for this purpose, for now the best we can do is follow the JGOFS-like model, but without the distributed data base. This will first involve • Creating a data inventory – meta data: who, what, where, when, how? • Establishing cruise log sheets for all shipboard activities • Creating hyperlinks (on web) to meta data & distributed data • Then (next yr?) putting metadata into a relational db (JGOFS model) CLIMODE: 9/2005
CLIMODE Data Issues 2 Major Data Types • Cruises • (aircraft) • CTD • ADCP • TSG • SeaSoar • AMP • IMET/DC • Salinity, oxygen, nuts. • Radiosondes • Satellite • NRT SST, SSH, winds • Res. Quality of above • NWP & OA fluxes • Moorings • Met buoy • Moored profilers • Nitrate • CO2? • Lagrangian • Drifters • Bobbers • Argo (w/T,S,O2) • FILIS/ASIS/ADCP Models NCEP ETA MIT – ‘realistic’ NWP output Ocean Assimilations? CLIMODE: 9/2005
CLIMODE Data Issues 3 Pre-Cruise data inventory form – Draft. This is needed prior to each cruise. PIs having multiple measurement systems need to fill out multiple lines.We need to define the types of data to be collected & by whom. CLIMODE: 9/2005
CLIMODE Data Issues 4 Sample Cruise Event Log – Draft, each over the side or up in the air activity must be logged. This is the principal summary of all cruise activity and must be filled out as it happens. CLIMODE: 9/2005